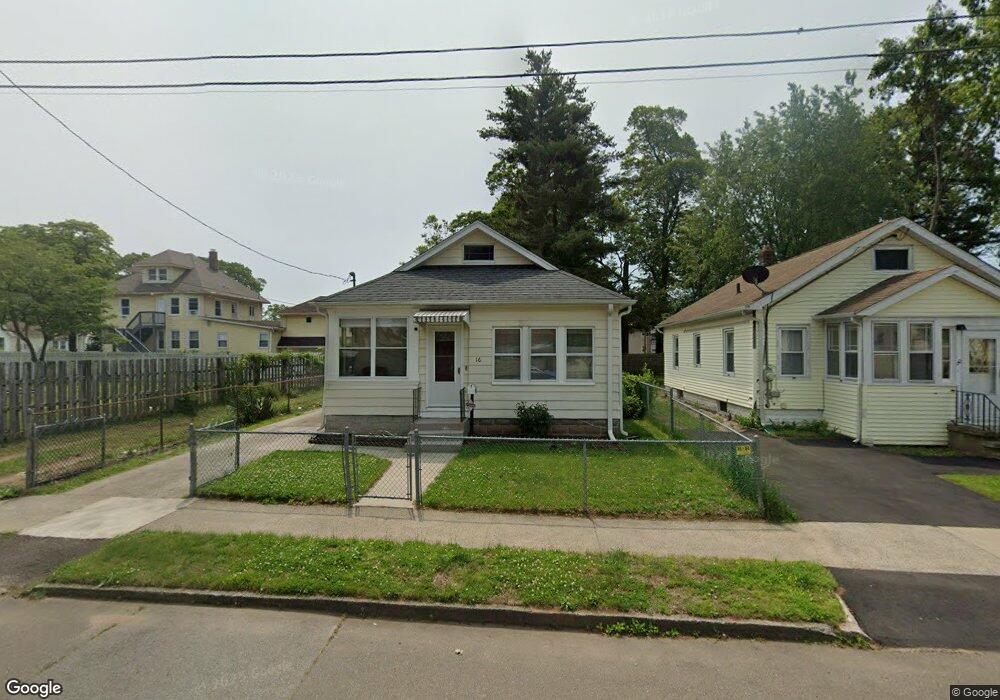
16 Marshall St West Haven, CT 06516
West Haven Center NeighborhoodEstimated Value: $264,000 - $318,000
2
Beds
3
Baths
840
Sq Ft
$346/Sq Ft
Est. Value
About This Home
This home is located at 16 Marshall St, West Haven, CT 06516 and is currently estimated at $290,691, approximately $346 per square foot. 16 Marshall St is a home located in New Haven County with nearby schools including Carrigan 5/6 Intermediate School, Harry M. Bailey Middle School, and West Haven High School.
Ownership History
Date
Name
Owned For
Owner Type
Purchase Details
Closed on
Apr 27, 1998
Sold by
Muise Philip C and Muise Madalene A
Bought by
Bhojwani Kamlesh A and Bhojwani Wendy E
Current Estimated Value
Home Financials for this Owner
Home Financials are based on the most recent Mortgage that was taken out on this home.
Original Mortgage
$60,000
Outstanding Balance
$11,734
Interest Rate
7.11%
Mortgage Type
Purchase Money Mortgage
Estimated Equity
$278,957
Purchase Details
Closed on
Mar 22, 1994
Sold by
Brandao Herculano M and Brandao Maria I
Bought by
Muise Phillip C and Muise Madelene A
Create a Home Valuation Report for This Property
The Home Valuation Report is an in-depth analysis detailing your home's value as well as a comparison with similar homes in the area
Home Values in the Area
Average Home Value in this Area
Purchase History
| Date | Buyer | Sale Price | Title Company |
|---|---|---|---|
| Bhojwani Kamlesh A | $80,000 | -- | |
| Muise Phillip C | $92,000 | -- | |
| Bhojwani Kamlesh A | $80,000 | -- | |
| Muise Phillip C | $92,000 | -- |
Source: Public Records
Mortgage History
| Date | Status | Borrower | Loan Amount |
|---|---|---|---|
| Open | Muise Phillip C | $60,000 | |
| Closed | Muise Phillip C | $60,000 |
Source: Public Records
Tax History
| Year | Tax Paid | Tax Assessment Tax Assessment Total Assessment is a certain percentage of the fair market value that is determined by local assessors to be the total taxable value of land and additions on the property. | Land | Improvement |
|---|---|---|---|---|
| 2025 | $5,613 | $162,540 | $56,210 | $106,330 |
| 2024 | $4,816 | $99,260 | $38,920 | $60,340 |
| 2023 | $4,617 | $99,260 | $38,920 | $60,340 |
| 2022 | $4,526 | $99,260 | $38,920 | $60,340 |
| 2021 | $4,526 | $99,260 | $38,920 | $60,340 |
| 2020 | $4,490 | $88,970 | $31,220 | $57,750 |
| 2019 | $4,330 | $88,970 | $31,220 | $57,750 |
| 2018 | $4,293 | $88,970 | $31,220 | $57,750 |
| 2017 | $4,062 | $88,970 | $31,220 | $57,750 |
| 2016 | $4,053 | $88,970 | $31,220 | $57,750 |
| 2015 | $3,966 | $98,280 | $35,000 | $63,280 |
| 2014 | $3,941 | $98,280 | $35,000 | $63,280 |
Source: Public Records
Map
Nearby Homes
Your Personal Tour Guide
Ask me questions while you tour the home.