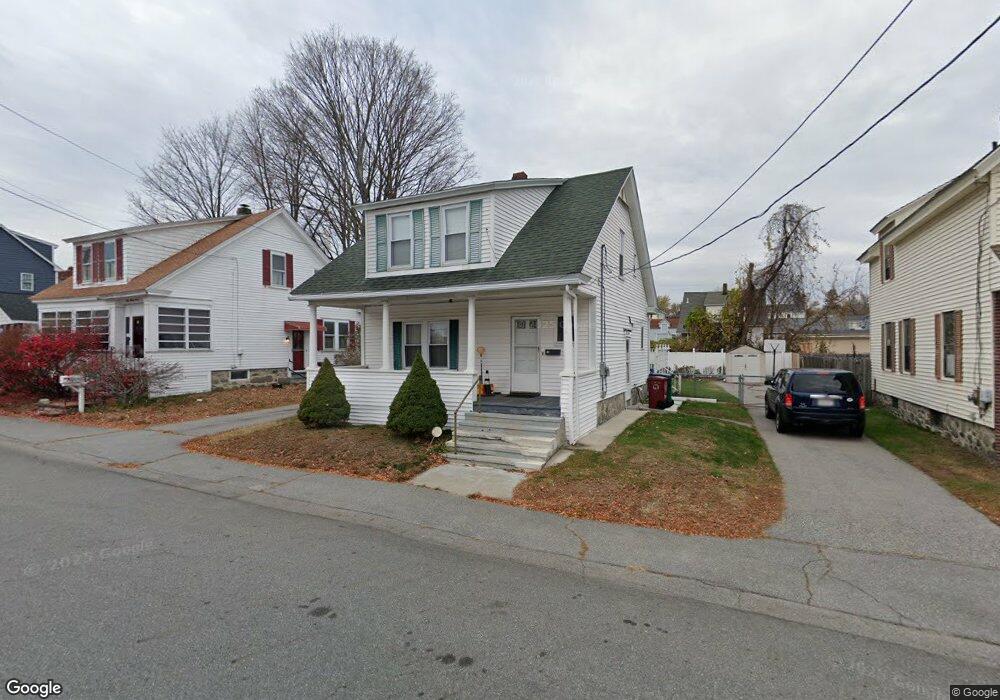
16 Martin St Lowell, MA 01854
Pawtucketville NeighborhoodEstimated Value: $332,000 - $527,000
3
Beds
1
Bath
1,348
Sq Ft
$344/Sq Ft
Est. Value
About This Home
This home is located at 16 Martin St, Lowell, MA 01854 and is currently estimated at $463,147, approximately $343 per square foot. 16 Martin St is a home located in Middlesex County with nearby schools including Joseph McAvinnue Elementary School, Charlotte M. Murkland Elementary School, and Charles W. Morey Elementary School.
Ownership History
Date
Name
Owned For
Owner Type
Purchase Details
Closed on
Jul 28, 2009
Sold by
Fhlmc
Bought by
Kungu Margaret N
Current Estimated Value
Home Financials for this Owner
Home Financials are based on the most recent Mortgage that was taken out on this home.
Original Mortgage
$147,200
Outstanding Balance
$97,770
Interest Rate
5.58%
Mortgage Type
Purchase Money Mortgage
Estimated Equity
$365,377
Purchase Details
Closed on
Apr 8, 2009
Sold by
Hall Mark D and Taylor Bean
Bought by
Fhlmc
Purchase Details
Closed on
Jun 14, 1999
Sold by
Lemieux Ernest J and Lemieux Clarie S
Bought by
Hall Mark D and Hall Renee M
Create a Home Valuation Report for This Property
The Home Valuation Report is an in-depth analysis detailing your home's value as well as a comparison with similar homes in the area
Home Values in the Area
Average Home Value in this Area
Purchase History
| Date | Buyer | Sale Price | Title Company |
|---|---|---|---|
| Kungu Margaret N | $155,000 | -- | |
| Kungu Margaret N | $155,000 | -- | |
| Fhlmc | $157,252 | -- | |
| Fhlmc | $157,252 | -- | |
| Hall Mark D | $118,000 | -- | |
| Hall Mark D | $118,000 | -- |
Source: Public Records
Mortgage History
| Date | Status | Borrower | Loan Amount |
|---|---|---|---|
| Open | Kungu Margaret N | $147,200 | |
| Closed | Hall Mark D | $147,200 | |
| Previous Owner | Hall Mark D | $26,000 | |
| Previous Owner | Hall Mark D | $114,350 |
Source: Public Records
Tax History Compared to Growth
Tax History
| Year | Tax Paid | Tax Assessment Tax Assessment Total Assessment is a certain percentage of the fair market value that is determined by local assessors to be the total taxable value of land and additions on the property. | Land | Improvement |
|---|---|---|---|---|
| 2025 | $4,718 | $411,000 | $169,900 | $241,100 |
| 2024 | $4,473 | $375,600 | $148,200 | $227,400 |
| 2023 | $4,130 | $332,500 | $123,100 | $209,400 |
| 2022 | $3,823 | $301,300 | $111,900 | $189,400 |
| 2021 | $3,566 | $264,900 | $97,300 | $167,600 |
| 2020 | $3,353 | $251,000 | $91,000 | $160,000 |
| 2019 | $3,110 | $221,500 | $84,200 | $137,300 |
| 2018 | $3,041 | $211,300 | $80,200 | $131,100 |
| 2017 | $2,938 | $196,900 | $72,900 | $124,000 |
| 2016 | $2,470 | $162,900 | $61,100 | $101,800 |
| 2015 | $2,426 | $156,700 | $62,500 | $94,200 |
| 2013 | $2,415 | $160,900 | $77,100 | $83,800 |
Source: Public Records
Map
Nearby Homes