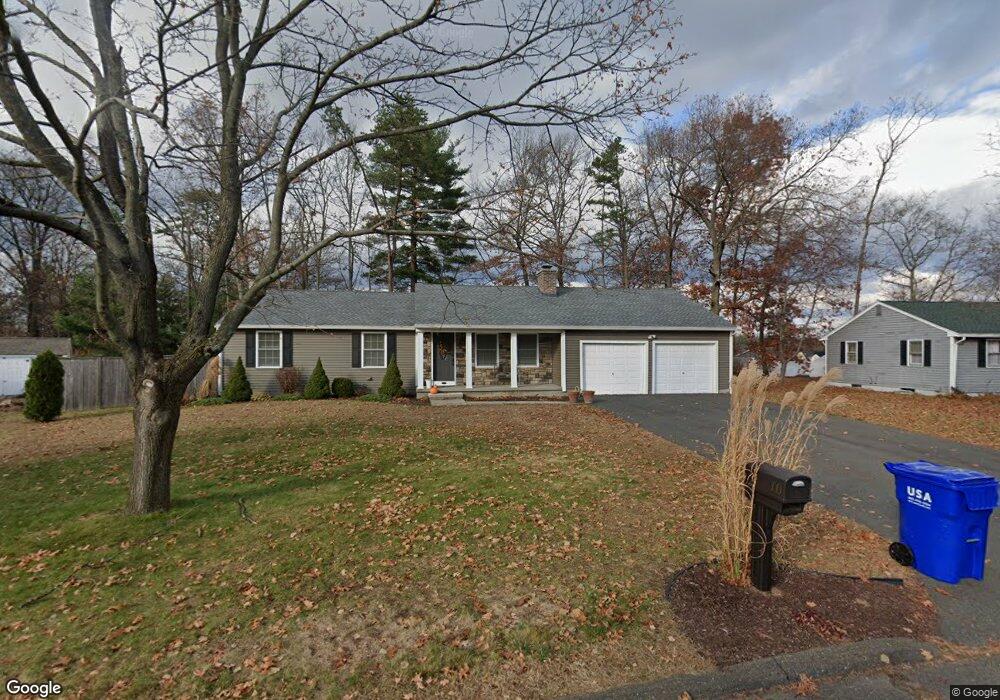
16 Melinda Ln Easthampton, MA 01027
Estimated Value: $415,000 - $445,000
3
Beds
2
Baths
1,204
Sq Ft
$360/Sq Ft
Est. Value
About This Home
This home is located at 16 Melinda Ln, Easthampton, MA 01027 and is currently estimated at $433,794, approximately $360 per square foot. 16 Melinda Ln is a home located in Hampshire County with nearby schools including Easthampton High School, Calvary Baptist Christian School, and Tri-County Schools.
Ownership History
Date
Name
Owned For
Owner Type
Purchase Details
Closed on
Aug 26, 2011
Sold by
Towne Jr Theodore D and Towne Charlene K
Bought by
Ceccarini Shelby
Current Estimated Value
Home Financials for this Owner
Home Financials are based on the most recent Mortgage that was taken out on this home.
Original Mortgage
$134,000
Outstanding Balance
$92,937
Interest Rate
4.53%
Mortgage Type
Purchase Money Mortgage
Estimated Equity
$340,857
Purchase Details
Closed on
Mar 4, 2011
Sold by
Sample Rt
Bought by
Towne Jr Theodore D and Towne Charlene K
Create a Home Valuation Report for This Property
The Home Valuation Report is an in-depth analysis detailing your home's value as well as a comparison with similar homes in the area
Home Values in the Area
Average Home Value in this Area
Purchase History
| Date | Buyer | Sale Price | Title Company |
|---|---|---|---|
| Ceccarini Shelby | $259,000 | -- | |
| Towne Jr Theodore D | $190,000 | -- |
Source: Public Records
Mortgage History
| Date | Status | Borrower | Loan Amount |
|---|---|---|---|
| Open | Ceccarini Shelby | $134,000 |
Source: Public Records
Tax History Compared to Growth
Tax History
| Year | Tax Paid | Tax Assessment Tax Assessment Total Assessment is a certain percentage of the fair market value that is determined by local assessors to be the total taxable value of land and additions on the property. | Land | Improvement |
|---|---|---|---|---|
| 2025 | $5,255 | $384,400 | $121,300 | $263,100 |
| 2024 | $5,077 | $374,400 | $118,000 | $256,400 |
| 2023 | $3,849 | $262,700 | $93,200 | $169,500 |
| 2022 | $4,342 | $262,700 | $93,200 | $169,500 |
| 2021 | $4,755 | $271,100 | $93,200 | $177,900 |
| 2020 | $4,666 | $262,700 | $93,200 | $169,500 |
| 2019 | $3,907 | $252,700 | $93,200 | $159,500 |
| 2018 | $3,742 | $233,900 | $87,800 | $146,100 |
| 2017 | $3,654 | $225,400 | $84,300 | $141,100 |
| 2016 | $3,643 | $233,700 | $84,300 | $149,400 |
| 2015 | $3,541 | $233,700 | $84,300 | $149,400 |
Source: Public Records
Map
Nearby Homes