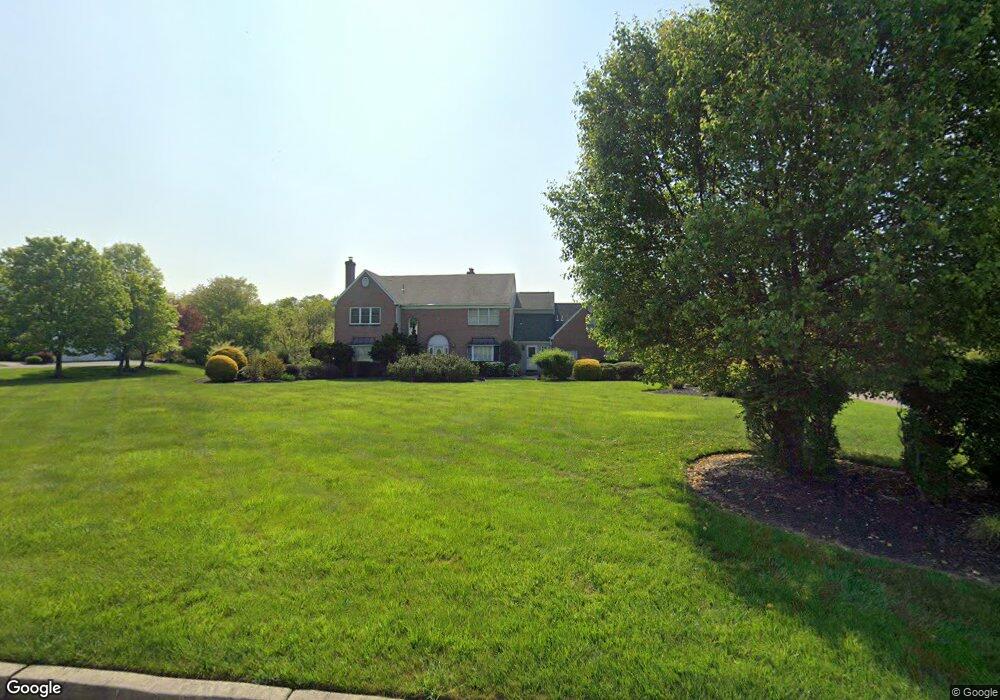
16 Michael Way Pennington, NJ 08534
Estimated Value: $1,269,559 - $1,510,000
5
Beds
5
Baths
4,114
Sq Ft
$341/Sq Ft
Est. Value
About This Home
This home is located at 16 Michael Way, Pennington, NJ 08534 and is currently estimated at $1,401,640, approximately $340 per square foot. 16 Michael Way is a home located in Mercer County with nearby schools including Hopewell Valley Central High School, Pennington Montessori School, and The Laurel School of Princeton.
Ownership History
Date
Name
Owned For
Owner Type
Purchase Details
Closed on
Dec 27, 1995
Sold by
Anganos David
Bought by
Barbhaiya Rashmi
Current Estimated Value
Home Financials for this Owner
Home Financials are based on the most recent Mortgage that was taken out on this home.
Original Mortgage
$43,000
Outstanding Balance
$1,165
Interest Rate
7.33%
Estimated Equity
$1,400,475
Purchase Details
Closed on
Jul 11, 1994
Sold by
Chowdhury Bhanwarlal
Bought by
Barbahaiya Rashmi and Barbahaiya Abhilashia
Home Financials for this Owner
Home Financials are based on the most recent Mortgage that was taken out on this home.
Original Mortgage
$393,000
Interest Rate
8.19%
Purchase Details
Closed on
Jun 30, 1988
Sold by
Rock Hill Builders Inc
Bought by
Chowdhury Bharwarlal
Create a Home Valuation Report for This Property
The Home Valuation Report is an in-depth analysis detailing your home's value as well as a comparison with similar homes in the area
Home Values in the Area
Average Home Value in this Area
Purchase History
| Date | Buyer | Sale Price | Title Company |
|---|---|---|---|
| Barbhaiya Rashmi | $61,000 | -- | |
| Barbahaiya Rashmi | $550,000 | -- | |
| Chowdhury Bharwarlal | $430,000 | -- |
Source: Public Records
Mortgage History
| Date | Status | Borrower | Loan Amount |
|---|---|---|---|
| Open | Barbhaiya Rashmi | $43,000 | |
| Previous Owner | Barbahaiya Rashmi | $393,000 |
Source: Public Records
Tax History
| Year | Tax Paid | Tax Assessment Tax Assessment Total Assessment is a certain percentage of the fair market value that is determined by local assessors to be the total taxable value of land and additions on the property. | Land | Improvement |
|---|---|---|---|---|
| 2025 | $24,183 | $766,000 | $318,600 | $447,400 |
| 2024 | $23,409 | $766,000 | $318,600 | $447,400 |
| 2023 | $23,409 | $766,000 | $318,600 | $447,400 |
| 2022 | $22,926 | $766,000 | $318,600 | $447,400 |
| 2021 | $23,432 | $766,000 | $318,600 | $447,400 |
| 2020 | $22,865 | $766,000 | $318,600 | $447,400 |
| 2019 | $21,348 | $733,100 | $318,600 | $414,500 |
| 2018 | $20,952 | $733,100 | $318,600 | $414,500 |
| 2017 | $20,380 | $733,100 | $318,600 | $414,500 |
| 2016 | $19,266 | $733,100 | $318,600 | $414,500 |
| 2015 | $22,050 | $830,500 | $358,400 | $472,100 |
| 2014 | $21,593 | $830,500 | $358,400 | $472,100 |
Source: Public Records
Map
Nearby Homes
- 329 Penn Titusville Rd
- 20 Route 31 S
- 186 Penn Harbourton Rd
- 172 Pennington Harbourton Rd
- 407 Reading St
- 22 Hallett Dr
- 111 Laning Ave
- 9 Hallett Dr
- 0 Penn Titusville Rd Unit BLK 62.01. LOT 80.01
- 0 Penn Titusville Rd Unit BLK 62.01. LOT 80.03
- 0 Penn Titusville Rd Unit BLK 62.01. LOT 80.02
- 10 Madaket Ln
- 228 S Main St
- 212 Ingleside Ave
- 205 Ingleside Ave
- 160 Leona Stewart Ln
- 2304 Prince Hall Dr
- 162 Leona Stewart Ln
- 2106 Prince Hall Dr
- 2105 Prince Hall Dr
Your Personal Tour Guide
Ask me questions while you tour the home.