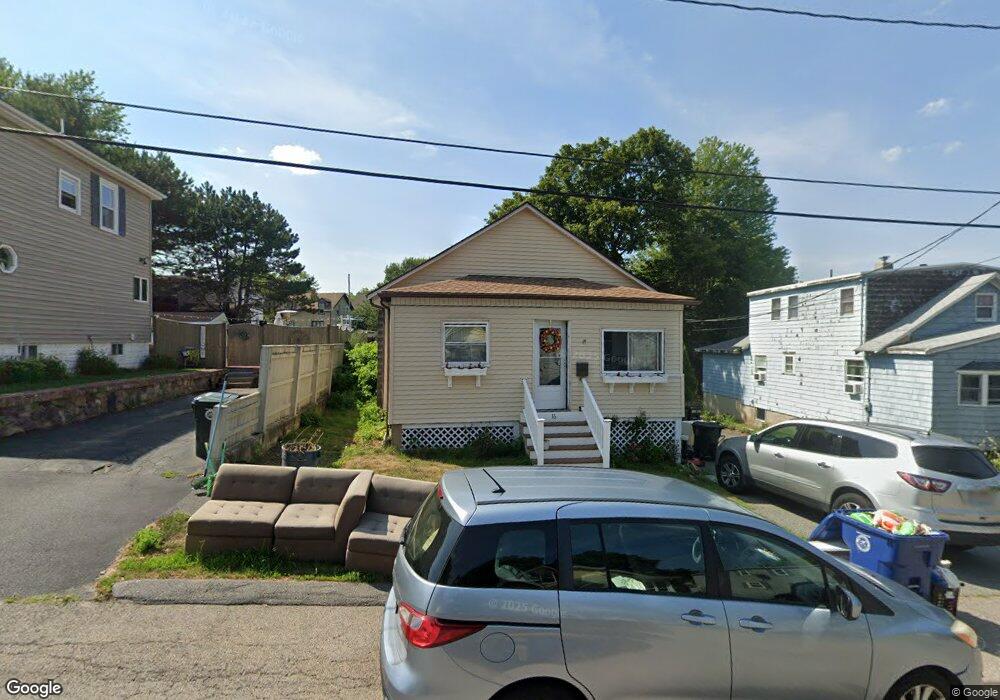
16 Milton Rd Danvers, MA 01923
Estimated Value: $560,516 - $706,000
2
Beds
1
Bath
1,300
Sq Ft
$476/Sq Ft
Est. Value
About This Home
This home is located at 16 Milton Rd, Danvers, MA 01923 and is currently estimated at $619,379, approximately $476 per square foot. 16 Milton Rd is a home located in Essex County with nearby schools including St. Mary of the Annunciation School, St. John's Prep, and Bishop Fenwick High School.
Ownership History
Date
Name
Owned For
Owner Type
Purchase Details
Closed on
Feb 28, 2006
Sold by
Crandall Jonathan M
Bought by
Maynard Eric F and Maynard Julie
Current Estimated Value
Home Financials for this Owner
Home Financials are based on the most recent Mortgage that was taken out on this home.
Original Mortgage
$300,600
Outstanding Balance
$169,887
Interest Rate
6.17%
Mortgage Type
Purchase Money Mortgage
Estimated Equity
$449,492
Purchase Details
Closed on
Jul 29, 2005
Sold by
Cole Gary L and Pisanelli-Cole Kirsten A
Bought by
Crandall Jonathan M
Home Financials for this Owner
Home Financials are based on the most recent Mortgage that was taken out on this home.
Original Mortgage
$245,700
Interest Rate
5.67%
Mortgage Type
Purchase Money Mortgage
Purchase Details
Closed on
Sep 30, 1997
Sold by
Casali John E and Casali Linda M
Bought by
Cole Gary
Create a Home Valuation Report for This Property
The Home Valuation Report is an in-depth analysis detailing your home's value as well as a comparison with similar homes in the area
Home Values in the Area
Average Home Value in this Area
Purchase History
| Date | Buyer | Sale Price | Title Company |
|---|---|---|---|
| Maynard Eric F | $334,000 | -- | |
| Crandall Jonathan M | $273,000 | -- | |
| Cole Gary | $129,500 | -- |
Source: Public Records
Mortgage History
| Date | Status | Borrower | Loan Amount |
|---|---|---|---|
| Open | Cole Gary | $300,600 | |
| Previous Owner | Cole Gary | $245,700 | |
| Previous Owner | Cole Gary | $255,000 |
Source: Public Records
Tax History Compared to Growth
Tax History
| Year | Tax Paid | Tax Assessment Tax Assessment Total Assessment is a certain percentage of the fair market value that is determined by local assessors to be the total taxable value of land and additions on the property. | Land | Improvement |
|---|---|---|---|---|
| 2025 | $5,058 | $460,200 | $316,600 | $143,600 |
| 2024 | $4,853 | $436,800 | $294,400 | $142,400 |
| 2023 | $4,782 | $407,000 | $274,400 | $132,600 |
| 2022 | $4,779 | $377,500 | $249,900 | $127,600 |
| 2021 | $4,643 | $347,800 | $246,200 | $101,600 |
| 2020 | $4,469 | $342,200 | $213,300 | $128,900 |
| 2019 | $4,449 | $335,000 | $200,000 | $135,000 |
| 2018 | $4,568 | $337,400 | $214,400 | $123,000 |
| 2017 | $4,109 | $289,600 | $166,600 | $123,000 |
| 2016 | $4,003 | $281,900 | $158,900 | $123,000 |
| 2015 | $3,805 | $255,200 | $144,400 | $110,800 |
Source: Public Records
Map
Nearby Homes
- 24 Purchase St
- 166 High St
- 86 Abington Rd Unit 86
- 108 Abington Rd Unit 108
- 112 Abington Rd
- 14 1/2 Hampshire St
- 5 Beacon St
- 38 High St Unit 4
- 5 Hampshire St
- 35 High St Unit 3D
- 20 Ash St Unit 3
- 20 Ash St Unit 1
- 81 Elliott St
- 37 Constitution Ln Unit 12
- 8 Putnam St Unit 3
- 11 Holten St
- 100 Poplar St
- 117 Elliott St
- 25 Cherry St Unit 3
- 9 Endicott St Unit B