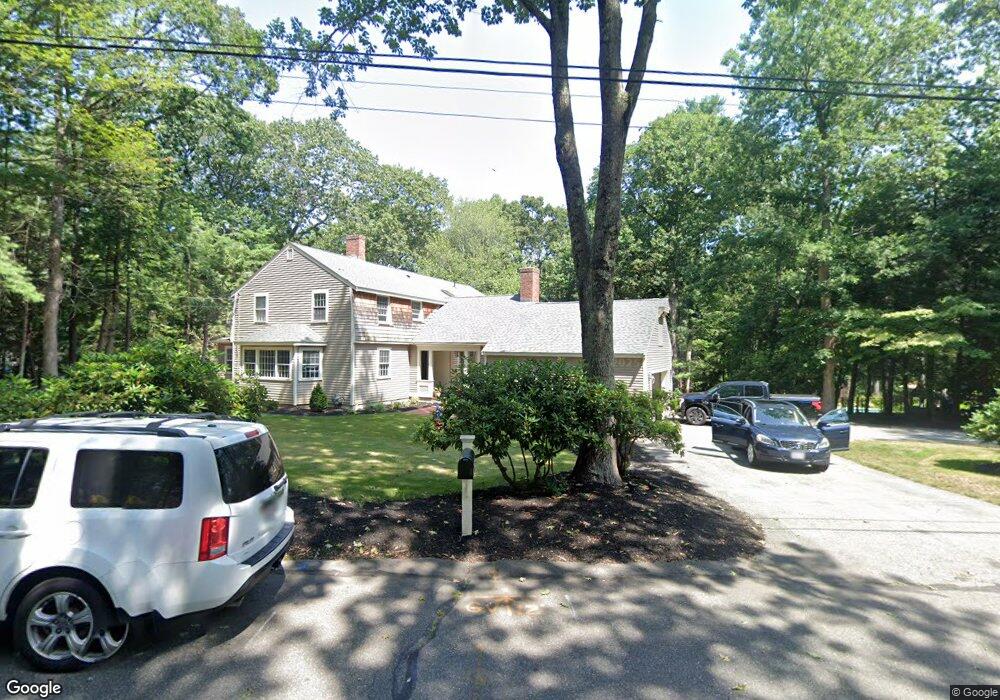
16 Morgan St Wenham, MA 01984
Estimated Value: $1,261,717 - $1,417,000
4
Beds
2
Baths
3,639
Sq Ft
$363/Sq Ft
Est. Value
About This Home
This home is located at 16 Morgan St, Wenham, MA 01984 and is currently estimated at $1,319,239, approximately $362 per square foot. 16 Morgan St is a home located in Essex County with nearby schools including Winthrop School, Bessie Buker Elementary School, and Cutler Elementary School.
Ownership History
Date
Name
Owned For
Owner Type
Purchase Details
Closed on
Feb 12, 2021
Sold by
Bishop Kirk C
Bought by
Kirk C Bishop 2021 Irt and Fleckner
Current Estimated Value
Purchase Details
Closed on
Dec 8, 2020
Sold by
Bishop Julie N and Bishop Kirk C
Bought by
Bishop Kirk C
Purchase Details
Closed on
Apr 4, 2018
Sold by
Bishop Julie C and Bishop Kirk C
Bought by
Bishop Julie N and Bishop Kirk C
Purchase Details
Closed on
Nov 1, 1989
Sold by
Funchion Matthew
Bought by
Bishop Kirk
Purchase Details
Closed on
Sep 19, 1988
Sold by
Perregaux Paul A
Bought by
Funchion Matthew J
Create a Home Valuation Report for This Property
The Home Valuation Report is an in-depth analysis detailing your home's value as well as a comparison with similar homes in the area
Home Values in the Area
Average Home Value in this Area
Purchase History
| Date | Buyer | Sale Price | Title Company |
|---|---|---|---|
| Kirk C Bishop 2021 Irt | -- | None Available | |
| Bishop Kirk C | -- | None Available | |
| Bishop Julie N | -- | -- | |
| Bishop Kirk | $446,250 | -- | |
| Bishop Kirk | $446,250 | -- | |
| Funchion Matthew J | $413,500 | -- |
Source: Public Records
Mortgage History
| Date | Status | Borrower | Loan Amount |
|---|---|---|---|
| Previous Owner | Funchion Matthew J | $240,500 | |
| Previous Owner | Funchion Matthew J | $233,000 | |
| Previous Owner | Funchion Matthew J | $197,000 |
Source: Public Records
Tax History
| Year | Tax Paid | Tax Assessment Tax Assessment Total Assessment is a certain percentage of the fair market value that is determined by local assessors to be the total taxable value of land and additions on the property. | Land | Improvement |
|---|---|---|---|---|
| 2025 | $17,009 | $1,094,500 | $565,300 | $529,200 |
| 2024 | $16,656 | $1,063,600 | $565,300 | $498,300 |
| 2023 | $16,755 | $965,700 | $592,400 | $373,300 |
| 2022 | $18,464 | $943,000 | $550,900 | $392,100 |
| 2021 | $17,787 | $903,800 | $511,700 | $392,100 |
| 2020 | $16,635 | $878,300 | $511,700 | $366,600 |
| 2019 | $15,827 | $878,300 | $511,700 | $366,600 |
| 2018 | $14,301 | $761,100 | $436,200 | $324,900 |
| 2017 | $13,951 | $761,100 | $436,200 | $324,900 |
| 2016 | $12,923 | $761,100 | $436,200 | $324,900 |
| 2015 | $12,368 | $761,100 | $436,200 | $324,900 |
Source: Public Records
Map
Nearby Homes
Your Personal Tour Guide
Ask me questions while you tour the home.