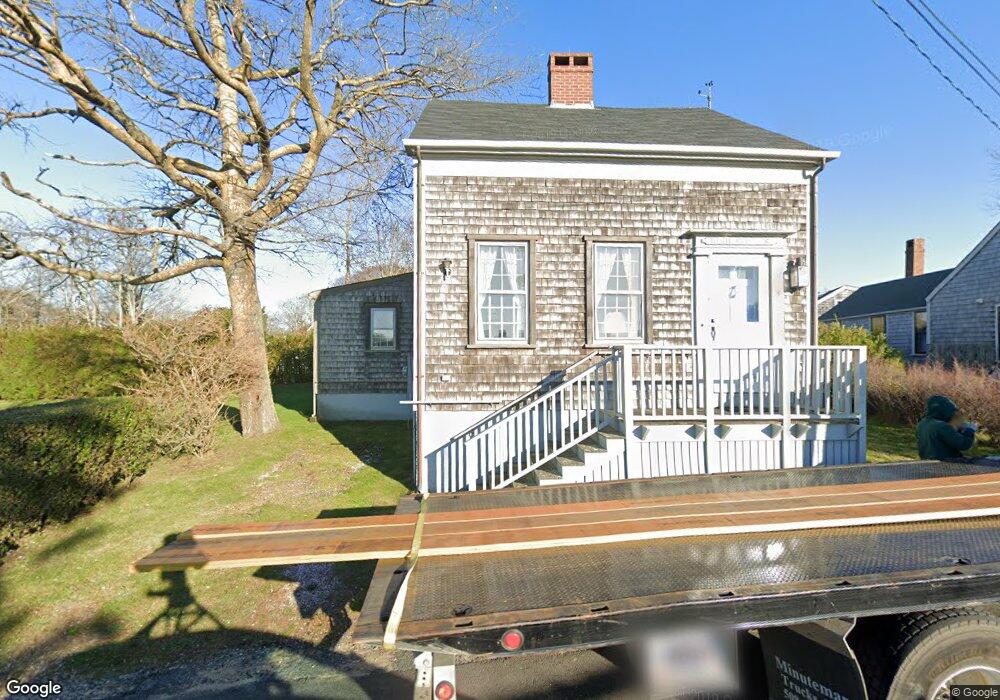
16 Mount Vernon St Nantucket, MA 02554
Estimated Value: $1,974,000 - $3,013,000
2
Beds
3
Baths
876
Sq Ft
$2,848/Sq Ft
Est. Value
About This Home
This home is located at 16 Mount Vernon St, Nantucket, MA 02554 and is currently estimated at $2,494,661, approximately $2,847 per square foot. 16 Mount Vernon St is a home located in Nantucket County with nearby schools including Nantucket Elementary School, Cyrus Peirce Middle School, and Nantucket High School.
Ownership History
Date
Name
Owned For
Owner Type
Purchase Details
Closed on
Jan 19, 2007
Sold by
Strain Anne P and Wood Anne P
Bought by
Strain Tr Anne P and Strain-Smythe Karen
Current Estimated Value
Purchase Details
Closed on
May 3, 1991
Sold by
Davis Martha W
Bought by
Wood Hilliard O and Wood Anne P
Create a Home Valuation Report for This Property
The Home Valuation Report is an in-depth analysis detailing your home's value as well as a comparison with similar homes in the area
Home Values in the Area
Average Home Value in this Area
Purchase History
| Date | Buyer | Sale Price | Title Company |
|---|---|---|---|
| Strain Tr Anne P | -- | -- | |
| Strain Tr Anne P | -- | -- | |
| Strain Tr Anne P | -- | -- | |
| Wood Hilliard O | $325,000 | -- | |
| Wood Hilliard O | $325,000 | -- |
Source: Public Records
Tax History Compared to Growth
Tax History
| Year | Tax Paid | Tax Assessment Tax Assessment Total Assessment is a certain percentage of the fair market value that is determined by local assessors to be the total taxable value of land and additions on the property. | Land | Improvement |
|---|---|---|---|---|
| 2025 | $5,581 | $1,701,500 | $1,073,200 | $628,300 |
| 2024 | $5,145 | $1,643,900 | $1,031,900 | $612,000 |
| 2023 | $4,374 | $1,362,600 | $905,100 | $457,500 |
| 2022 | $4,024 | $1,076,000 | $692,000 | $384,000 |
| 2021 | $3,934 | $1,083,800 | $659,000 | $424,800 |
| 2020 | $3,965 | $1,149,200 | $659,000 | $490,200 |
| 2019 | $3,829 | $1,139,700 | $649,500 | $490,200 |
| 2018 | $3,561 | $1,008,900 | $649,500 | $359,400 |
| 2017 | $3,365 | $992,600 | $649,500 | $343,100 |
| 2016 | $3,299 | $981,800 | $649,500 | $332,300 |
| 2015 | $3,817 | $1,057,400 | $561,500 | $495,900 |
| 2014 | $3,976 | $1,057,400 | $561,500 | $495,900 |
Source: Public Records
Map
Nearby Homes