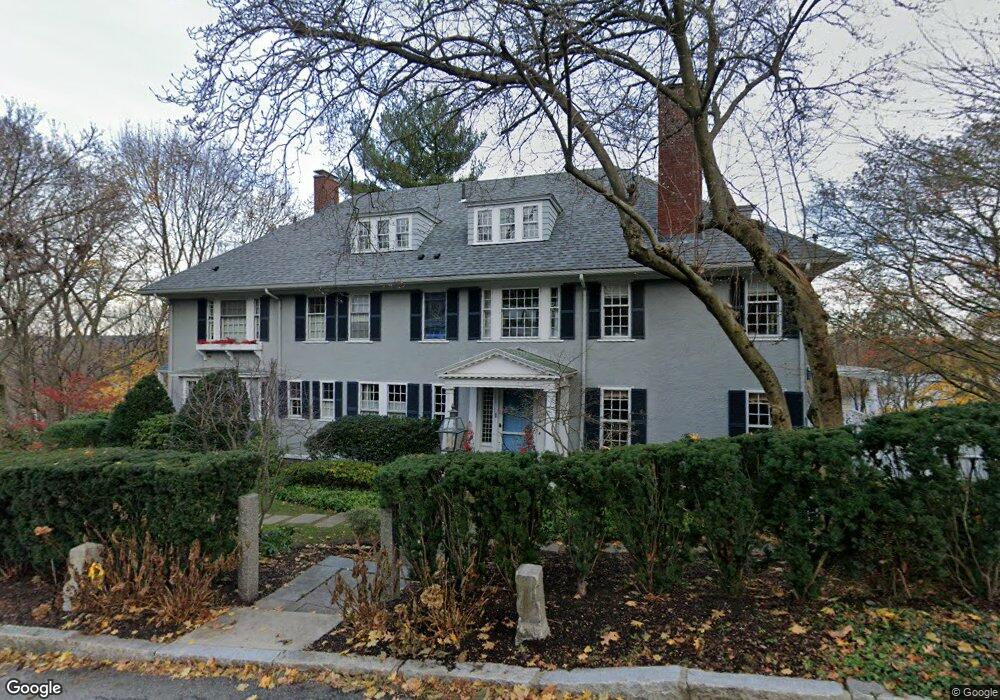
16 Myopia Rd Winchester, MA 01890
Estimated Value: $2,494,821 - $3,040,000
5
Beds
6
Baths
5,593
Sq Ft
$505/Sq Ft
Est. Value
About This Home
This home is located at 16 Myopia Rd, Winchester, MA 01890 and is currently estimated at $2,822,455, approximately $504 per square foot. 16 Myopia Rd is a home located in Middlesex County with nearby schools including Ambrose Elementary School, McCall Middle School, and Winchester High School.
Ownership History
Date
Name
Owned For
Owner Type
Purchase Details
Closed on
Jun 2, 2016
Sold by
Gregory Christopher and Gregory Kyle C
Bought by
Kyle Carney Gregory T
Current Estimated Value
Purchase Details
Closed on
May 10, 1996
Sold by
Guarnotta Joseph E and Guarnotta Doris B
Bought by
Gregory Christopher and Gregory Kyle C
Home Financials for this Owner
Home Financials are based on the most recent Mortgage that was taken out on this home.
Original Mortgage
$207,000
Interest Rate
6.9%
Purchase Details
Closed on
Aug 5, 1994
Sold by
Micavich Michael A
Bought by
Gregory Christopher and Gregory Kyle C
Create a Home Valuation Report for This Property
The Home Valuation Report is an in-depth analysis detailing your home's value as well as a comparison with similar homes in the area
Purchase History
| Date | Buyer | Sale Price | Title Company |
|---|---|---|---|
| Kyle Carney Gregory T | -- | -- | |
| Gregory Christopher | $125,000 | -- | |
| Gregory Christopher | $610,000 | -- |
Source: Public Records
Mortgage History
| Date | Status | Borrower | Loan Amount |
|---|---|---|---|
| Previous Owner | Gregory Christopher | $191,000 | |
| Previous Owner | Gregory Christopher | $207,000 | |
| Previous Owner | Gregory Christopher | $40,000 |
Source: Public Records
Tax History Compared to Growth
Tax History
| Year | Tax Paid | Tax Assessment Tax Assessment Total Assessment is a certain percentage of the fair market value that is determined by local assessors to be the total taxable value of land and additions on the property. | Land | Improvement |
|---|---|---|---|---|
| 2025 | $23,708 | $2,137,800 | $930,500 | $1,207,300 |
| 2024 | $23,617 | $2,084,500 | $930,500 | $1,154,000 |
| 2023 | $22,005 | $1,864,800 | $874,500 | $990,300 |
| 2022 | $21,665 | $1,731,800 | $789,900 | $941,900 |
| 2021 | $8,144 | $1,633,800 | $691,900 | $941,900 |
| 2020 | $7,026 | $1,633,800 | $691,900 | $941,900 |
| 2019 | $19,022 | $1,570,800 | $628,900 | $941,900 |
| 2018 | $6,839 | $1,535,400 | $617,700 | $917,700 |
| 2017 | $18,438 | $1,501,500 | $617,700 | $883,800 |
| 2016 | $17,199 | $1,472,500 | $617,700 | $854,800 |
| 2015 | $16,957 | $1,396,800 | $561,700 | $835,100 |
| 2014 | $17,042 | $1,346,100 | $511,300 | $834,800 |
Source: Public Records
Map
Nearby Homes
- 35 Glen Green
- 27 Everett Ave
- 20 Grove Place
- 9 Lakeview Terrace
- 61 Westland Ave
- 89 Wildwood St
- 139 High St
- 6 Ivy Cir
- 46 Church St
- 7 Trinity Rd
- 335 Mystic St
- 10 Viking Rd
- 26 North Gateway
- 1 Town Way
- 16 Ridge St
- 33 Dickson Ave
- 19 Town Way
- 666 Main St Unit 315
- 666 Main St Unit 312
- 36 Middlesex St Unit 38