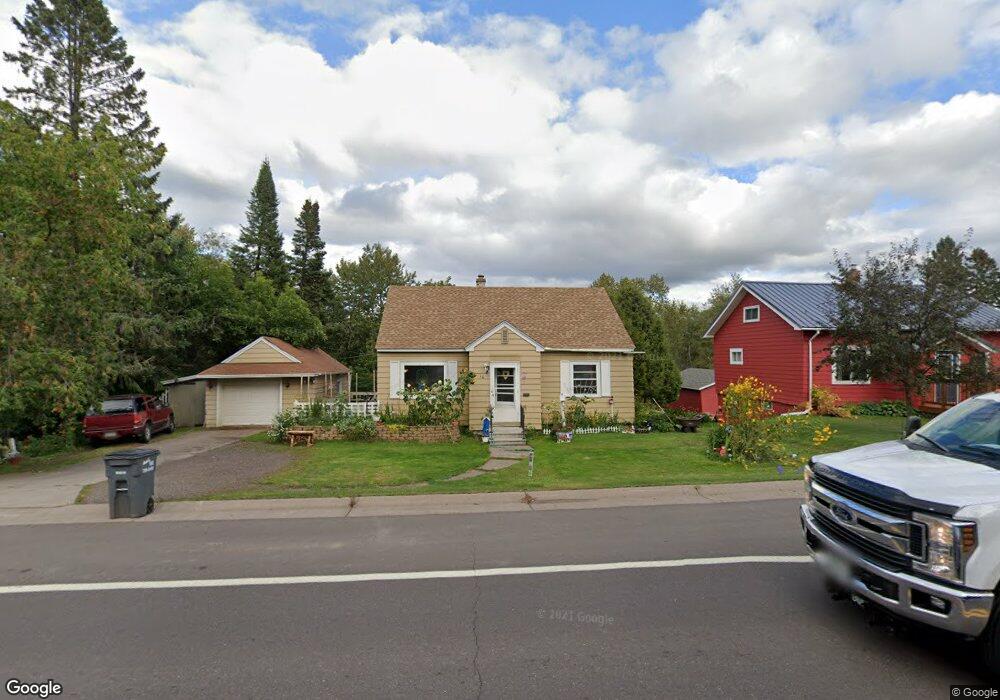
16 N Boundary Ave Duluth, MN 55810
Bayview Heights NeighborhoodEstimated Value: $201,000 - $245,000
3
Beds
2
Baths
1,248
Sq Ft
$178/Sq Ft
Est. Value
About This Home
This home is located at 16 N Boundary Ave, Duluth, MN 55810 and is currently estimated at $222,257, approximately $178 per square foot. 16 N Boundary Ave is a home located in St. Louis County with nearby schools including Bay View Elementary School, Jedlicka Middle School, and Proctor Senior High School.
Ownership History
Date
Name
Owned For
Owner Type
Purchase Details
Closed on
Aug 29, 2024
Sold by
Johnson Carol A
Bought by
Meunier Amanda J
Current Estimated Value
Home Financials for this Owner
Home Financials are based on the most recent Mortgage that was taken out on this home.
Original Mortgage
$80,000
Outstanding Balance
$78,922
Interest Rate
5.5%
Mortgage Type
New Conventional
Estimated Equity
$143,335
Create a Home Valuation Report for This Property
The Home Valuation Report is an in-depth analysis detailing your home's value as well as a comparison with similar homes in the area
Home Values in the Area
Average Home Value in this Area
Purchase History
| Date | Buyer | Sale Price | Title Company |
|---|---|---|---|
| Meunier Amanda J | $100,000 | Pioneer Title |
Source: Public Records
Mortgage History
| Date | Status | Borrower | Loan Amount |
|---|---|---|---|
| Open | Meunier Amanda J | $80,000 |
Source: Public Records
Tax History Compared to Growth
Tax History
| Year | Tax Paid | Tax Assessment Tax Assessment Total Assessment is a certain percentage of the fair market value that is determined by local assessors to be the total taxable value of land and additions on the property. | Land | Improvement |
|---|---|---|---|---|
| 2024 | $1,752 | $160,000 | $14,400 | $145,600 |
| 2023 | $1,752 | $160,000 | $14,400 | $145,600 |
| 2022 | $1,956 | $154,700 | $21,600 | $133,100 |
| 2021 | $1,676 | $130,000 | $18,200 | $111,800 |
| 2020 | $1,432 | $127,400 | $17,900 | $109,500 |
| 2019 | $1,396 | $111,600 | $15,700 | $95,900 |
| 2018 | $1,232 | $111,600 | $15,700 | $95,900 |
| 2017 | $1,182 | $101,400 | $25,600 | $75,800 |
| 2016 | $1,132 | $101,400 | $25,600 | $75,800 |
| 2015 | $1,050 | $73,300 | $18,500 | $54,800 |
| 2014 | $1,050 | $73,300 | $18,500 | $54,800 |
Source: Public Records
Map
Nearby Homes
- 14 3rd St
- XXXX Meadow St
- 110 Grove St
- 121 Oak St
- 63 S Elder Dr
- 9237 Lawn St
- 10 Spruce Dr
- 502 3rd Ave
- 706 N Boundary Ave
- 618 3rd St
- 623 3rd St
- xxxx Yellow Birch Trail
- 1125 3rd Ave
- 20 Village Dr Unit 206
- 20 Village Dr
- 519 N 81st Ave W
- 523 S 72nd Ave W
- 5105 Sheridan Rd
- 3xx N 83rd Ave W
- 322 N 80th Ave W