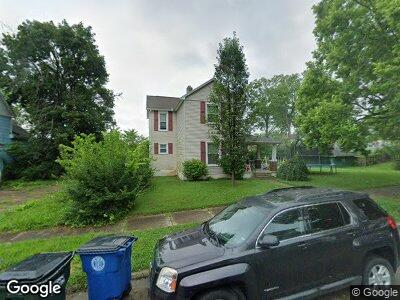
16 N Plaza Ave Dayton, OH 45417
Westwood NeighborhoodEstimated Value: $46,000 - $95,000
3
Beds
2
Baths
1,288
Sq Ft
$55/Sq Ft
Est. Value
About This Home
This home is located at 16 N Plaza Ave, Dayton, OH 45417 and is currently estimated at $70,748, approximately $54 per square foot. 16 N Plaza Ave is a home located in Montgomery County with nearby schools including International School at Residence Park, Westwood Elementary, and Louise Troy Elementary.
Ownership History
Date
Name
Owned For
Owner Type
Purchase Details
Closed on
May 9, 2018
Sold by
Haycook Heather E and Haycook Heather E
Bought by
Gem Cit Real Estate Llc
Current Estimated Value
Purchase Details
Closed on
Jan 24, 2012
Sold by
Fannie Mae
Bought by
Griesheimer Heather E
Purchase Details
Closed on
Jan 18, 2012
Sold by
Passmore Shaun A
Bought by
Federal National Mortgage Association
Purchase Details
Closed on
Dec 29, 2004
Sold by
Passmore Donna
Bought by
Passmore Shaun A
Purchase Details
Closed on
Dec 27, 1999
Sold by
Archie Whatley
Bought by
Passmore Shaun A and Passmore Donna
Home Financials for this Owner
Home Financials are based on the most recent Mortgage that was taken out on this home.
Original Mortgage
$1,786
Interest Rate
7.76%
Mortgage Type
Stand Alone Second
Purchase Details
Closed on
Dec 8, 1997
Sold by
Whatley Archie
Bought by
Whatley Archie and Whatley Wilhelmenia
Create a Home Valuation Report for This Property
The Home Valuation Report is an in-depth analysis detailing your home's value as well as a comparison with similar homes in the area
Home Values in the Area
Average Home Value in this Area
Purchase History
| Date | Buyer | Sale Price | Title Company |
|---|---|---|---|
| Gem Cit Real Estate Llc | $10,000 | None Available | |
| Griesheimer Heather E | $7,200 | Accutitle Agency | |
| Federal National Mortgage Association | $8,000 | None Available | |
| Passmore Shaun A | -- | None Available | |
| Passmore Shaun A | $49,900 | -- | |
| Whatley Archie | -- | -- |
Source: Public Records
Mortgage History
| Date | Status | Borrower | Loan Amount |
|---|---|---|---|
| Previous Owner | Passmore Shaun A | $1,786 | |
| Previous Owner | Passmore Shaun A | $59,500 |
Source: Public Records
Tax History Compared to Growth
Tax History
| Year | Tax Paid | Tax Assessment Tax Assessment Total Assessment is a certain percentage of the fair market value that is determined by local assessors to be the total taxable value of land and additions on the property. | Land | Improvement |
|---|---|---|---|---|
| 2024 | $751 | $12,780 | $3,470 | $9,310 |
| 2023 | $751 | $12,780 | $3,470 | $9,310 |
| 2022 | $791 | $10,420 | $2,820 | $7,600 |
| 2021 | $787 | $10,420 | $2,820 | $7,600 |
| 2020 | $785 | $10,420 | $2,820 | $7,600 |
| 2019 | $815 | $9,630 | $2,820 | $6,810 |
| 2018 | $795 | $9,630 | $2,820 | $6,810 |
| 2017 | $789 | $9,630 | $2,820 | $6,810 |
| 2016 | $833 | $9,690 | $2,820 | $6,870 |
| 2015 | $789 | $9,690 | $2,820 | $6,870 |
| 2014 | $789 | $9,690 | $2,820 | $6,870 |
| 2012 | -- | $16,800 | $4,430 | $12,370 |
Source: Public Records
Map
Nearby Homes
- 2905 W Third St
- 309 Leland Ave
- 221 Brooklyn Ave
- 260 Westwood Ave
- 273 Westwood Ave
- 3272 Mccall St
- 79 N Alder St
- 320 Huron Ave
- 422 Burleigh Ave
- 38 N Hatfield St
- 126 Arlington Ave
- 2819 Mccall St
- 0 N Gettysburg Ave
- 3001 Edison St
- 432 N Gettysburg Ave
- 524 Crestmore Ave
- 427 Brooklyn Ave
- 2723 Jerome Ave
- 605 N Gettysburg Ave
- 712 N Gettysburg Ave