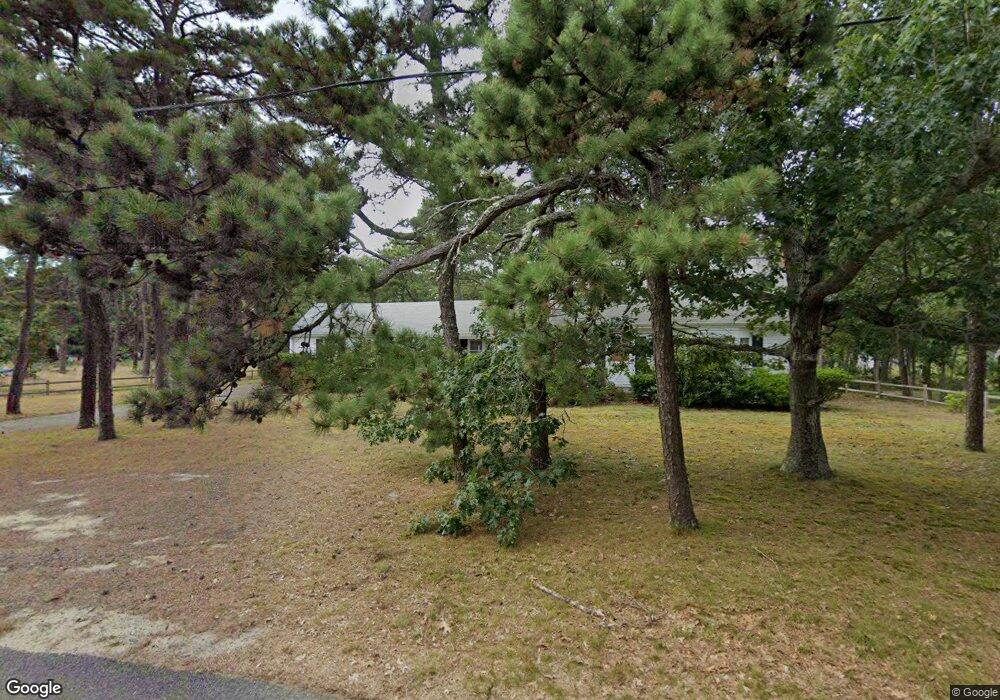
16 Old Saga Dr South Yarmouth, MA 02664
South Yarmouth NeighborhoodEstimated Value: $728,458 - $785,000
4
Beds
2
Baths
1,600
Sq Ft
$481/Sq Ft
Est. Value
About This Home
This home is located at 16 Old Saga Dr, South Yarmouth, MA 02664 and is currently estimated at $770,365, approximately $481 per square foot. 16 Old Saga Dr is a home located in Barnstable County with nearby schools including Dennis-Yarmouth Regional High School and St. Pius X. School.
Ownership History
Date
Name
Owned For
Owner Type
Purchase Details
Closed on
Dec 12, 2024
Sold by
Newman Thomas G and Mastropolo Rosalie M
Bought by
Newman Ft and Newman
Current Estimated Value
Purchase Details
Closed on
Feb 16, 2007
Sold by
Jordan-Muratore Helen M
Bought by
Mastropolo Rosalie M and Newman Thomas G
Home Financials for this Owner
Home Financials are based on the most recent Mortgage that was taken out on this home.
Original Mortgage
$293,200
Interest Rate
6.24%
Mortgage Type
Purchase Money Mortgage
Purchase Details
Closed on
Jul 15, 1994
Sold by
Lundgren Lorraine A
Bought by
Jordan Helen M
Home Financials for this Owner
Home Financials are based on the most recent Mortgage that was taken out on this home.
Original Mortgage
$100,000
Interest Rate
8.51%
Mortgage Type
Purchase Money Mortgage
Create a Home Valuation Report for This Property
The Home Valuation Report is an in-depth analysis detailing your home's value as well as a comparison with similar homes in the area
Home Values in the Area
Average Home Value in this Area
Purchase History
| Date | Buyer | Sale Price | Title Company |
|---|---|---|---|
| Newman Ft | -- | None Available | |
| Newman Ft | -- | None Available | |
| Mastropolo Rosalie M | $366,500 | -- | |
| Jordan Helen M | $143,000 | -- | |
| Mastropolo Rosalie M | $366,500 | -- | |
| Jordan Helen M | $143,000 | -- |
Source: Public Records
Mortgage History
| Date | Status | Borrower | Loan Amount |
|---|---|---|---|
| Previous Owner | Mastropolo Rosalie M | $293,200 | |
| Previous Owner | Jordan Helen M | $100,000 |
Source: Public Records
Tax History Compared to Growth
Tax History
| Year | Tax Paid | Tax Assessment Tax Assessment Total Assessment is a certain percentage of the fair market value that is determined by local assessors to be the total taxable value of land and additions on the property. | Land | Improvement |
|---|---|---|---|---|
| 2025 | $4,693 | $662,900 | $236,100 | $426,800 |
| 2024 | $4,340 | $588,100 | $205,400 | $382,700 |
| 2023 | $4,229 | $521,500 | $173,300 | $348,200 |
| 2022 | $4,178 | $455,100 | $155,100 | $300,000 |
| 2021 | $4,108 | $429,700 | $155,100 | $274,600 |
| 2020 | $3,938 | $393,800 | $152,500 | $241,300 |
| 2019 | $7,928 | $356,500 | $152,500 | $204,000 |
| 2018 | $3,576 | $347,500 | $143,500 | $204,000 |
| 2017 | $7,817 | $347,500 | $143,500 | $204,000 |
| 2016 | $3,468 | $347,500 | $143,500 | $204,000 |
| 2015 | $3,354 | $334,100 | $143,500 | $190,600 |
Source: Public Records
Map
Nearby Homes
- 85 Keel Cape Dr
- 91 Chipping Green Cir
- 62 Old Fish House Rd
- 23 Fairwood Rd
- 21 Green Way
- 17 Fairmount Rd
- 17 Fairmount Rd
- 6 Hawthorn St
- 7 Vinland Dr
- 30 Pebble Beach Way
- 10 Joanne Dr
- 129 Driftwood Ln
- 25 Skerry Rd
- 401 Main St Unit 201
- 401 Main St Unit 101
- 1 Norseman Dr
- 295 Main St
- 4 Old Colony Way
- 293 Main St
- 293 Main St