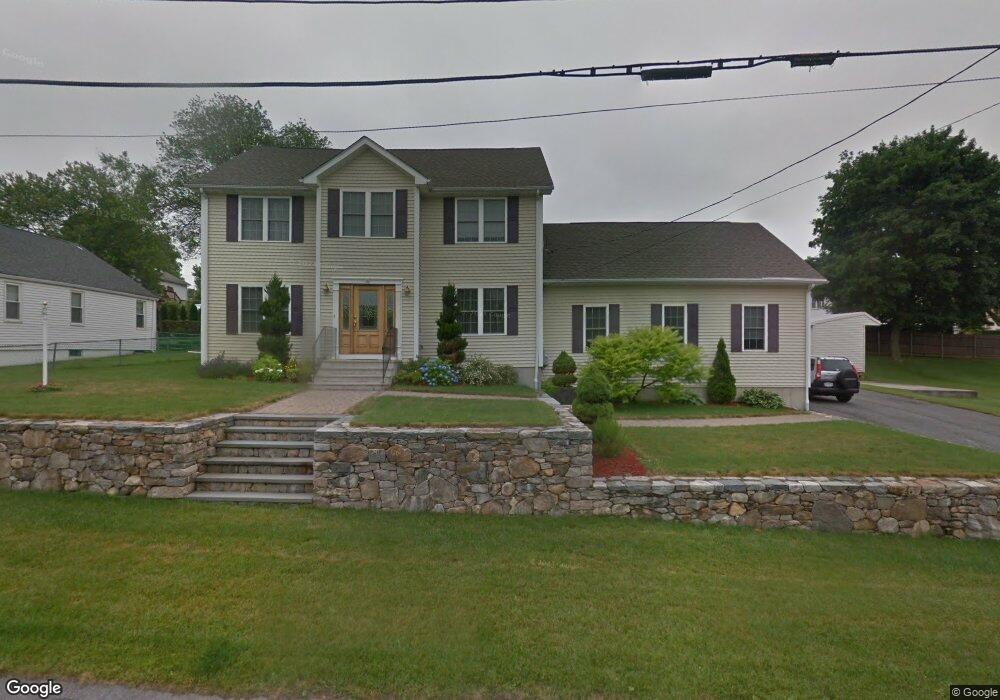
16 Ostend St Johnston, RI 02919
Hartford Avenue NeighborhoodEstimated Value: $573,000 - $745,000
3
Beds
3
Baths
2,212
Sq Ft
$285/Sq Ft
Est. Value
About This Home
This home is located at 16 Ostend St, Johnston, RI 02919 and is currently estimated at $630,176, approximately $284 per square foot. 16 Ostend St is a home located in Providence County with nearby schools including Johnston Senior High School, Achievement First Promesa, and Achievement First Providence Mayoral Academy Elementary School.
Ownership History
Date
Name
Owned For
Owner Type
Purchase Details
Closed on
Jun 11, 2008
Sold by
Martino Michael W and Martino Janet M
Bought by
Ly Ka Y
Current Estimated Value
Home Financials for this Owner
Home Financials are based on the most recent Mortgage that was taken out on this home.
Original Mortgage
$332,500
Interest Rate
6.13%
Mortgage Type
Purchase Money Mortgage
Purchase Details
Closed on
Oct 31, 2003
Sold by
Smith Scott
Bought by
Gould Gordon M and Gould Clair T
Purchase Details
Closed on
Sep 22, 1999
Sold by
Velino Frank A
Bought by
Sousa Richard S and Sousa Cynthia A
Create a Home Valuation Report for This Property
The Home Valuation Report is an in-depth analysis detailing your home's value as well as a comparison with similar homes in the area
Home Values in the Area
Average Home Value in this Area
Purchase History
| Date | Buyer | Sale Price | Title Company |
|---|---|---|---|
| Ly Ka Y | $350,000 | -- | |
| Gould Gordon M | $215,000 | -- | |
| Sousa Richard S | $88,000 | -- | |
| Ly Ka Y | $350,000 | -- | |
| Gould Gordon M | $215,000 | -- | |
| Sousa Richard S | $88,000 | -- |
Source: Public Records
Mortgage History
| Date | Status | Borrower | Loan Amount |
|---|---|---|---|
| Open | Sousa Richard S | $322,000 | |
| Closed | Sousa Richard S | $332,500 |
Source: Public Records
Tax History
| Year | Tax Paid | Tax Assessment Tax Assessment Total Assessment is a certain percentage of the fair market value that is determined by local assessors to be the total taxable value of land and additions on the property. | Land | Improvement |
|---|---|---|---|---|
| 2025 | $7,418 | $474,900 | $91,700 | $383,200 |
| 2024 | $7,266 | $474,900 | $91,700 | $383,200 |
| 2023 | $7,266 | $474,900 | $91,700 | $383,200 |
| 2022 | $5,533 | $297,600 | $70,400 | $227,200 |
| 2021 | $6,916 | $297,600 | $70,400 | $227,200 |
| 2018 | $7,521 | $273,600 | $55,300 | $218,300 |
| 2016 | $9,951 | $273,600 | $55,300 | $218,300 |
| 2015 | $8,042 | $277,400 | $57,800 | $219,600 |
| 2014 | $6,380 | $277,400 | $57,800 | $219,600 |
| 2013 | $7,975 | $277,400 | $57,800 | $219,600 |
Source: Public Records
Map
Nearby Homes
- 56 N Olney St
- 46 Auburn Ave
- 1143 Hartford Ave Unit 4C
- 19 S Long St
- 16 Homestead Ave
- 50 Rosemont Ave
- 2 Fairmount Ave
- 91 Clifton St
- 0 Eagle St
- 27 Greenville Ave
- 24 Wilson Ave
- 0 Jackson Ave
- 35 Hedley Ave
- 23 Columbus Ave
- 33 Harding Ave
- 44 Herschel St
- 17 Middleton St
- 67 Herschel St
- 38 Klondike St
- 0 Orchard St Unit 1396400
Your Personal Tour Guide
Ask me questions while you tour the home.