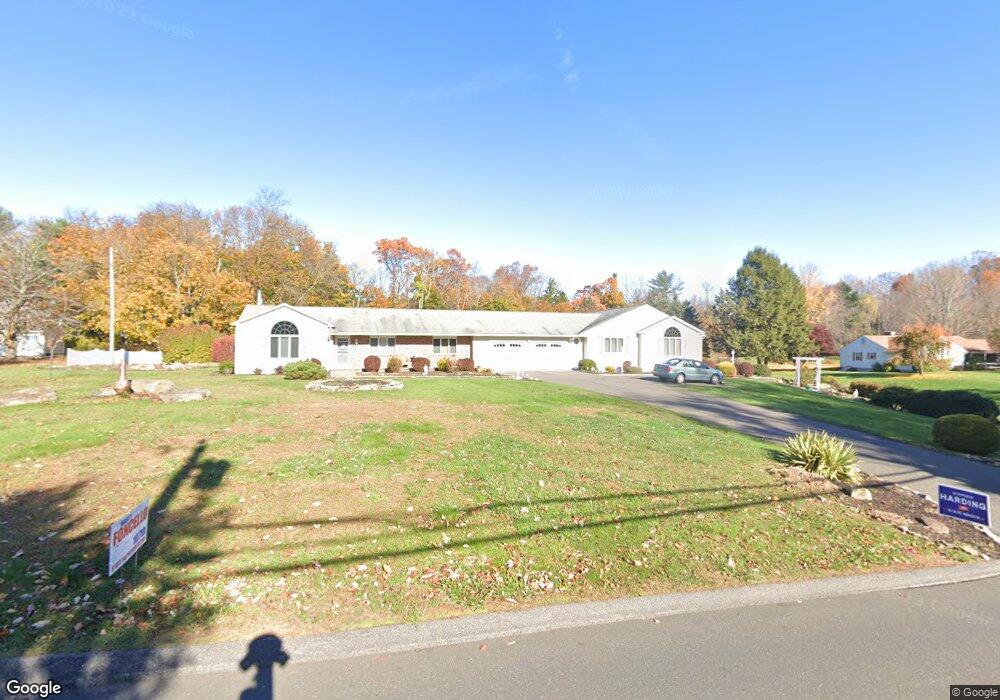
16 Overlook Dr Brookfield, CT 06804
Estimated Value: $720,000 - $1,032,000
6
Beds
5
Baths
4,148
Sq Ft
$226/Sq Ft
Est. Value
About This Home
This home is located at 16 Overlook Dr, Brookfield, CT 06804 and is currently estimated at $936,501, approximately $225 per square foot. 16 Overlook Dr is a home located in Fairfield County with nearby schools including Whisconier Middle School, Brookfield High School, and Montessori Community School at Brookfield.
Ownership History
Date
Name
Owned For
Owner Type
Purchase Details
Closed on
Jul 5, 2016
Sold by
Nacinovich Mario and Nacinovich Annette J
Bought by
Santiago Renee J
Current Estimated Value
Purchase Details
Closed on
Jun 20, 2016
Sold by
Nacinovich Mario and Nacinovich Annette J
Bought by
Nacinovich Mario and Nacinovich Annette J
Purchase Details
Closed on
Sep 30, 2010
Sold by
Nacinovich Mario
Bought by
Santiago Joe and Santiago Renee
Home Financials for this Owner
Home Financials are based on the most recent Mortgage that was taken out on this home.
Original Mortgage
$325,000
Interest Rate
4.44%
Purchase Details
Closed on
Jun 4, 2010
Sold by
Nacinovich Mario and Nacinovich Annette
Bought by
Nacinovich Mario and Nacinovich Annette
Purchase Details
Closed on
Jun 22, 2007
Sold by
Jimenez 2Nd Marco and Jimenez Crestine
Bought by
Nacinovich Mario and Nacinovich Annette
Create a Home Valuation Report for This Property
The Home Valuation Report is an in-depth analysis detailing your home's value as well as a comparison with similar homes in the area
Home Values in the Area
Average Home Value in this Area
Purchase History
| Date | Buyer | Sale Price | Title Company |
|---|---|---|---|
| Santiago Renee J | -- | -- | |
| Santiago Renee J | -- | -- | |
| Nacinovich Mario | -- | -- | |
| Nacinovich Mario | -- | -- | |
| Santiago Joe | $150,000 | -- | |
| Santiago Joe | $150,000 | -- | |
| Nacinovich Mario | -- | -- | |
| Nacinovich Mario | -- | -- | |
| Nacinovich Mario | $480,000 | -- | |
| Nacinovich Mario | $480,000 | -- |
Source: Public Records
Mortgage History
| Date | Status | Borrower | Loan Amount |
|---|---|---|---|
| Previous Owner | Nacinovich Mario | $325,000 |
Source: Public Records
Tax History
| Year | Tax Paid | Tax Assessment Tax Assessment Total Assessment is a certain percentage of the fair market value that is determined by local assessors to be the total taxable value of land and additions on the property. | Land | Improvement |
|---|---|---|---|---|
| 2025 | $15,311 | $529,240 | $105,740 | $423,500 |
| 2024 | $14,766 | $529,240 | $105,740 | $423,500 |
| 2023 | $14,215 | $529,240 | $105,740 | $423,500 |
| 2022 | $13,697 | $529,240 | $105,740 | $423,500 |
| 2021 | $11,510 | $382,390 | $117,500 | $264,890 |
| 2020 | $11,338 | $382,390 | $117,500 | $264,890 |
| 2019 | $11,143 | $382,390 | $117,500 | $264,890 |
| 2018 | $10,837 | $382,390 | $117,500 | $264,890 |
| 2017 | $10,435 | $382,390 | $117,500 | $264,890 |
| 2016 | $9,742 | $369,000 | $132,550 | $236,450 |
| 2015 | $9,483 | $369,000 | $132,550 | $236,450 |
| 2014 | $9,483 | $369,000 | $132,550 | $236,450 |
Source: Public Records
Map
Nearby Homes
- 48 High Ridge Rd
- 23 Sunset Hill Rd
- 5 Woodland Hills Terrace
- 29 Ledgewood Dr
- 70 Obtuse Hill Rd
- 112 A Stony Hill Rd
- 6 Comstock Trail Unit 6
- 27 Obtuse Rd S
- 19 A Apache Dr
- 99 Obtuse Hill Rd
- 6 Lyndenwood Dr
- 131 Pocono Rd
- 1 Essex Ct Unit 1
- 4 Arlington Ct
- 12 Oak Crest Dr
- 18 Dean Rd
- 11 Bramble Way
- 5 Bramble Way Unit Homesite 76
- 12 Bramble Way
- 43 Bramble Way
- 14 Overlook Dr
- 18 Overlook Dr
- 13 High Ridge Rd
- 15 High Ridge Rd
- 17 High Ridge Rd
- 9 Overlook Dr
- 7 Overlook Dr
- 11 Overlook Dr
- 12 Overlook Dr
- 19 High Ridge Rd
- 9 High Ridge Rd
- 5 Overlook Dr
- 12 High Ridge Rd
- 10 High Ridge Rd
- 14 High Ridge Rd
- 20 High Ridge Rd
- 21 High Ridge Rd
- 3 Overlook Dr
- 16 High Ridge Rd
- 10 Pritten Hill Rd