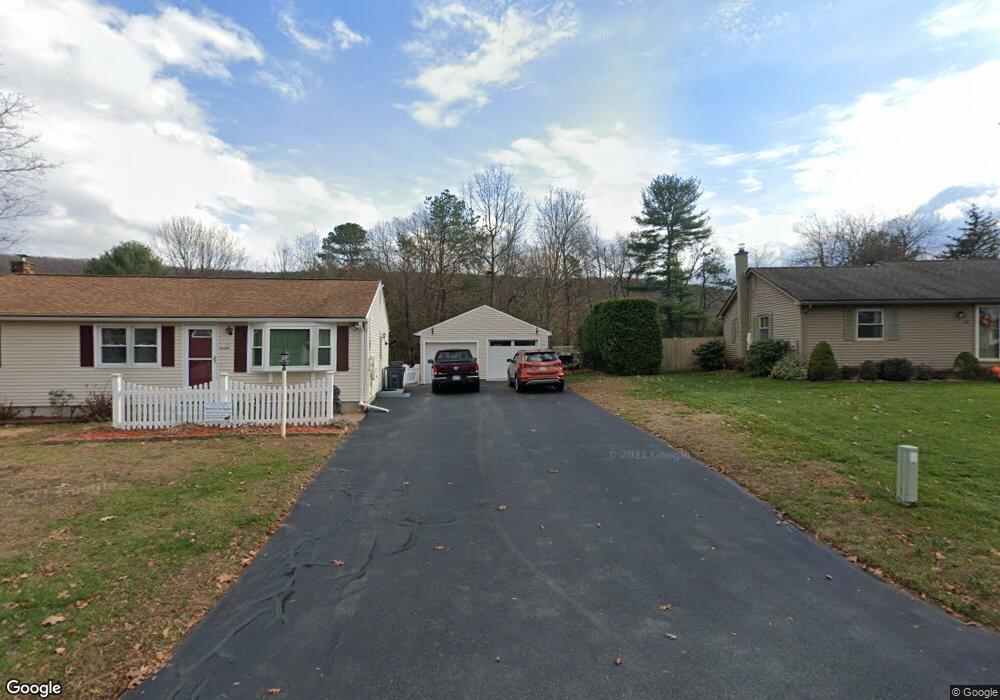
16 Overlook Dr Easthampton, MA 01027
Estimated Value: $389,000 - $422,000
3
Beds
3
Baths
1,398
Sq Ft
$293/Sq Ft
Est. Value
About This Home
This home is located at 16 Overlook Dr, Easthampton, MA 01027 and is currently estimated at $410,208, approximately $293 per square foot. 16 Overlook Dr is a home located in Hampshire County with nearby schools including Easthampton High School, Calvary Baptist Christian School, and Tri-County Schools.
Ownership History
Date
Name
Owned For
Owner Type
Purchase Details
Closed on
Jan 24, 2013
Sold by
Hutton David J
Bought by
Hutton Tina M
Current Estimated Value
Home Financials for this Owner
Home Financials are based on the most recent Mortgage that was taken out on this home.
Original Mortgage
$148,500
Outstanding Balance
$103,521
Interest Rate
3.35%
Mortgage Type
New Conventional
Estimated Equity
$306,687
Purchase Details
Closed on
Jul 31, 1998
Sold by
Badach Gregory J and Badach Naomi A
Bought by
Hutton David J and Hutton Tina
Create a Home Valuation Report for This Property
The Home Valuation Report is an in-depth analysis detailing your home's value as well as a comparison with similar homes in the area
Home Values in the Area
Average Home Value in this Area
Purchase History
| Date | Buyer | Sale Price | Title Company |
|---|---|---|---|
| Hutton Tina M | -- | -- | |
| Hutton David J | $122,500 | -- |
Source: Public Records
Mortgage History
| Date | Status | Borrower | Loan Amount |
|---|---|---|---|
| Open | Hutton David J | $148,500 | |
| Previous Owner | Hutton David J | $20,000 |
Source: Public Records
Tax History
| Year | Tax Paid | Tax Assessment Tax Assessment Total Assessment is a certain percentage of the fair market value that is determined by local assessors to be the total taxable value of land and additions on the property. | Land | Improvement |
|---|---|---|---|---|
| 2025 | $4,940 | $361,400 | $122,100 | $239,300 |
| 2024 | $4,769 | $351,700 | $118,400 | $233,300 |
| 2023 | $3,646 | $248,900 | $94,100 | $154,800 |
| 2022 | $4,114 | $248,900 | $94,100 | $154,800 |
| 2021 | $4,497 | $256,400 | $94,100 | $162,300 |
| 2020 | $4,420 | $248,900 | $94,100 | $154,800 |
| 2019 | $3,707 | $239,800 | $94,100 | $145,700 |
| 2018 | $3,555 | $222,200 | $88,600 | $133,600 |
| 2017 | $3,475 | $214,400 | $85,300 | $129,100 |
| 2016 | $3,608 | $231,400 | $85,300 | $146,100 |
| 2015 | $3,506 | $231,400 | $85,300 | $146,100 |
Source: Public Records
Map
Nearby Homes
Your Personal Tour Guide
Ask me questions while you tour the home.