Estimated Value: $522,584 - $650,000
4
Beds
2
Baths
1,972
Sq Ft
$298/Sq Ft
Est. Value
About This Home
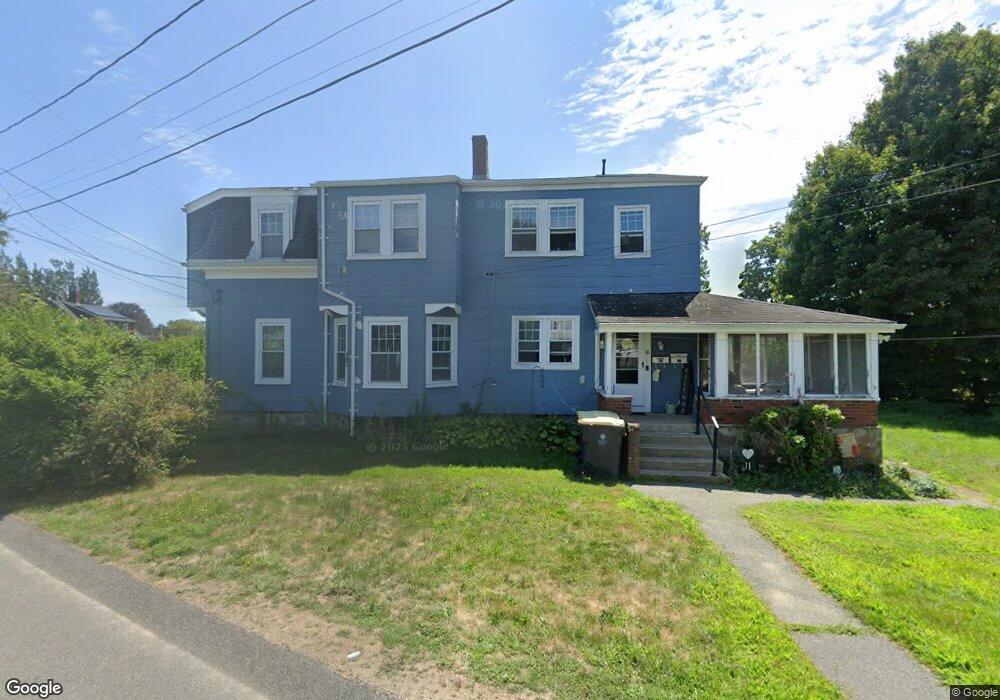
This home is located at 16 Pratt St, Avon, MA 02322 and is currently estimated at $586,896, approximately $297 per square foot. 16 Pratt St is a home located in Norfolk County with nearby schools including Ralph D. Butler Elementary School and Avon Middle/High School.
Ownership History
Date
Name
Owned For
Owner Type
Purchase Details
Closed on
Mar 28, 2006
Sold by
War Ft
Bought by
Rubino Wayne A
Current Estimated Value
Home Financials for this Owner
Home Financials are based on the most recent Mortgage that was taken out on this home.
Original Mortgage
$154,000
Interest Rate
6.28%
Purchase Details
Closed on
Nov 29, 2004
Sold by
Rubino Wayne A
Bought by
Warfamily Nt
Purchase Details
Closed on
Sep 7, 2004
Sold by
Rubino Wayne A
Bought by
Warfamily Nt and Rubino Wayne A
Purchase Details
Closed on
Oct 12, 1979
Bought by
Rubino Wayne A
Create a Home Valuation Report for This Property
The Home Valuation Report is an in-depth analysis detailing your home's value as well as a comparison with similar homes in the area
Home Values in the Area
Average Home Value in this Area
Purchase History
| Date | Buyer | Sale Price | Title Company |
|---|---|---|---|
| Rubino Wayne A | -- | -- | |
| Warfamily Nt | -- | -- | |
| Warfamily Nt | -- | -- | |
| Rubino Wayne A | $35,900 | -- |
Source: Public Records
Mortgage History
| Date | Status | Borrower | Loan Amount |
|---|---|---|---|
| Open | Rubino Wayne A | $240,000 | |
| Closed | Rubino Wayne A | $154,000 | |
| Previous Owner | Rubino Wayne A | $30,000 | |
| Previous Owner | Rubino Wayne A | $48,000 | |
| Previous Owner | Rubino Wayne A | $15,600 |
Source: Public Records
Tax History Compared to Growth
Tax History
| Year | Tax Paid | Tax Assessment Tax Assessment Total Assessment is a certain percentage of the fair market value that is determined by local assessors to be the total taxable value of land and additions on the property. | Land | Improvement |
|---|---|---|---|---|
| 2025 | $52 | $390,700 | $178,500 | $212,200 |
| 2024 | $5,351 | $381,400 | $169,200 | $212,200 |
| 2023 | $5,195 | $381,400 | $169,200 | $212,200 |
| 2022 | $4,719 | $298,500 | $141,000 | $157,500 |
| 2021 | $4,366 | $260,200 | $127,900 | $132,300 |
| 2020 | $4,544 | $256,700 | $125,400 | $131,300 |
| 2019 | $4,668 | $259,500 | $125,400 | $134,100 |
| 2018 | $4,814 | $259,500 | $125,400 | $134,100 |
| 2017 | $4,495 | $260,100 | $125,400 | $134,700 |
| 2016 | $4,192 | $245,000 | $125,500 | $119,500 |
| 2015 | $3,822 | $233,500 | $114,000 | $119,500 |
Source: Public Records
Map
Nearby Homes