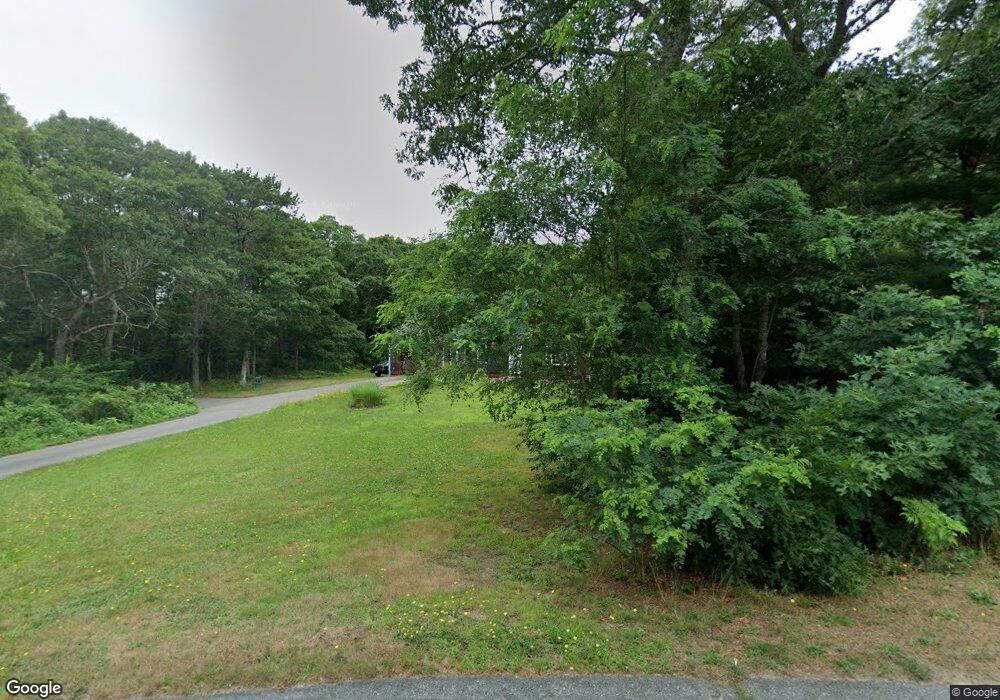
16 Pryer Dr Pocasset, MA 02559
Pocasset NeighborhoodEstimated Value: $581,000 - $652,000
3
Beds
2
Baths
1,608
Sq Ft
$383/Sq Ft
Est. Value
About This Home
This home is located at 16 Pryer Dr, Pocasset, MA 02559 and is currently estimated at $615,396, approximately $382 per square foot. 16 Pryer Dr is a home located in Barnstable County with nearby schools including Bourne High School, Cadence Academy Preschool - Bourne, and St Margaret Regional School.
Ownership History
Date
Name
Owned For
Owner Type
Purchase Details
Closed on
Dec 10, 2024
Sold by
Bohacs Elizabeth A and Bohacs Joseph J
Bought by
Bohacs Irt and Bretsch
Current Estimated Value
Purchase Details
Closed on
Dec 9, 2019
Sold by
Bohacs Joseph J and Bohacs Elizabeth A
Bought by
Bohacs Elizabeth A and Bohacs Joseph J
Create a Home Valuation Report for This Property
The Home Valuation Report is an in-depth analysis detailing your home's value as well as a comparison with similar homes in the area
Home Values in the Area
Average Home Value in this Area
Purchase History
| Date | Buyer | Sale Price | Title Company |
|---|---|---|---|
| Bohacs Irt | -- | None Available | |
| Bohacs Elizabeth A | -- | None Available |
Source: Public Records
Tax History Compared to Growth
Tax History
| Year | Tax Paid | Tax Assessment Tax Assessment Total Assessment is a certain percentage of the fair market value that is determined by local assessors to be the total taxable value of land and additions on the property. | Land | Improvement |
|---|---|---|---|---|
| 2025 | $4,058 | $519,600 | $213,400 | $306,200 |
| 2024 | $3,972 | $495,300 | $203,300 | $292,000 |
| 2023 | $3,896 | $442,200 | $179,900 | $262,300 |
| 2022 | $3,707 | $367,400 | $159,200 | $208,200 |
| 2021 | $3,603 | $334,500 | $144,900 | $189,600 |
| 2020 | $3,400 | $316,600 | $143,500 | $173,100 |
| 2019 | $3,224 | $306,800 | $143,500 | $163,300 |
| 2018 | $3,081 | $292,300 | $136,700 | $155,600 |
| 2017 | $2,982 | $289,500 | $135,400 | $154,100 |
| 2016 | $2,817 | $277,300 | $128,600 | $148,700 |
| 2015 | $2,792 | $277,300 | $128,600 | $148,700 |
Source: Public Records
Map
Nearby Homes