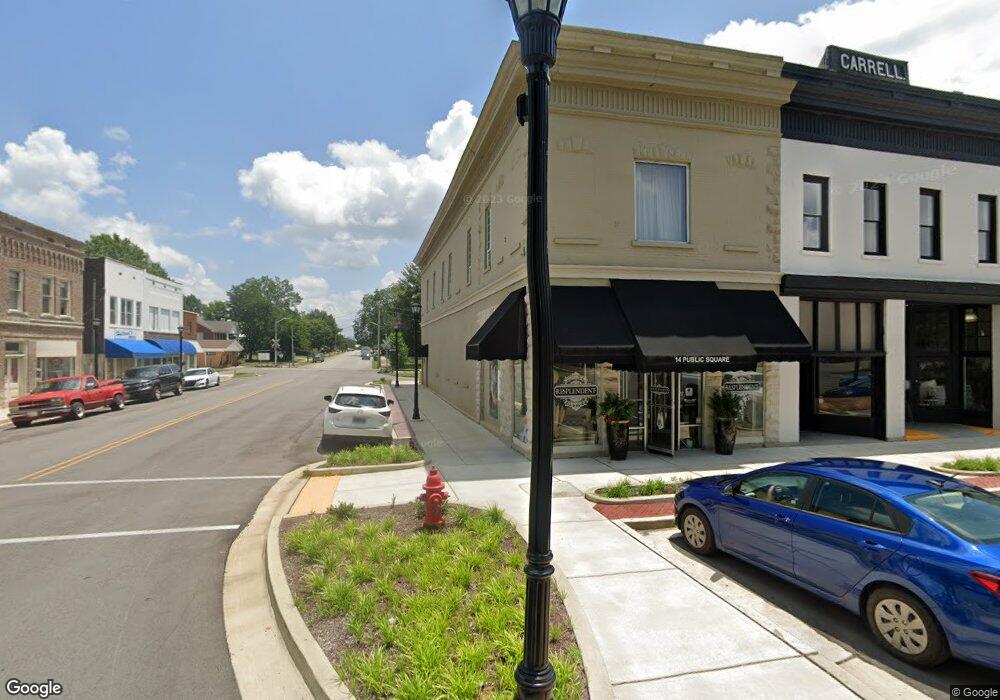
16 Public Square Lawrenceburg, TN 38464
Estimated Value: $609,167
--
Bed
4
Baths
1,600
Sq Ft
$381/Sq Ft
Est. Value
About This Home
This home is located at 16 Public Square, Lawrenceburg, TN 38464 and is currently estimated at $609,167, approximately $380 per square foot. 16 Public Square is a home located in Lawrence County with nearby schools including Ingram Sowell Elementary School, Lawrenceburg Public Elementary School, and David Crockett Elementary School.
Ownership History
Date
Name
Owned For
Owner Type
Purchase Details
Closed on
Jun 1, 2022
Sold by
William Sasser Iii
Bought by
Sasser William
Current Estimated Value
Purchase Details
Closed on
Nov 2, 2016
Sold by
Sasser & Thrasher Llc
Bought by
Sasser William
Purchase Details
Closed on
Jun 10, 2008
Sold by
Holly Oaks Partners Lp
Bought by
Sasser Thrasher Llc
Home Financials for this Owner
Home Financials are based on the most recent Mortgage that was taken out on this home.
Original Mortgage
$104,000
Interest Rate
6.04%
Mortgage Type
Commercial
Purchase Details
Closed on
Mar 14, 2003
Bought by
Holly Oaks Partners Lp % Ben Boston
Purchase Details
Closed on
Nov 30, 1999
Bought by
Beckman Todd and Beckman Kimberly
Purchase Details
Closed on
Jun 9, 1995
Bought by
Wright Freeman A and Wright Mary A
Purchase Details
Closed on
Jun 25, 1991
Bought by
Holt Barrington B and Wrigh Freeman A
Purchase Details
Closed on
Mar 6, 1990
Bought by
First Farmers & Merchants National Bank
Purchase Details
Closed on
Jan 22, 1982
Bought by
Johnston Ivan and Johnston Phyllis
Create a Home Valuation Report for This Property
The Home Valuation Report is an in-depth analysis detailing your home's value as well as a comparison with similar homes in the area
Home Values in the Area
Average Home Value in this Area
Purchase History
| Date | Buyer | Sale Price | Title Company |
|---|---|---|---|
| Sasser William | -- | Johnston & Street Pllc | |
| Sasser William | -- | -- | |
| Sasser Thrasher Llc | $150,000 | -- | |
| Holly Oaks Partners Lp % Ben Boston | $84,000 | -- | |
| Beckman Todd | $66,000 | -- | |
| Wright Freeman A | $17,100 | -- | |
| Holt Barrington B | $34,100 | -- | |
| First Farmers & Merchants National Bank | -- | -- | |
| Johnston Ivan | -- | -- |
Source: Public Records
Mortgage History
| Date | Status | Borrower | Loan Amount |
|---|---|---|---|
| Previous Owner | Johnston Ivan | $104,000 |
Source: Public Records
Tax History Compared to Growth
Tax History
| Year | Tax Paid | Tax Assessment Tax Assessment Total Assessment is a certain percentage of the fair market value that is determined by local assessors to be the total taxable value of land and additions on the property. | Land | Improvement |
|---|---|---|---|---|
| 2025 | $1,761 | $87,600 | $0 | $0 |
| 2024 | $2,723 | $87,600 | $6,720 | $80,880 |
| 2023 | $2,723 | $87,600 | $6,720 | $80,880 |
| 2022 | $2,723 | $87,600 | $6,720 | $80,880 |
| 2021 | $3,264 | $74,240 | $6,680 | $67,560 |
| 2020 | $3,264 | $74,240 | $6,680 | $67,560 |
| 2019 | $3,264 | $74,240 | $6,680 | $67,560 |
| 2018 | $3,264 | $74,240 | $6,680 | $67,560 |
| 2017 | $3,264 | $74,240 | $6,680 | $67,560 |
| 2016 | $3,264 | $74,240 | $6,680 | $67,560 |
| 2015 | $3,090 | $74,240 | $6,680 | $67,560 |
| 2014 | $3,098 | $74,440 | $6,680 | $67,760 |
Source: Public Records
Map
Nearby Homes
- 213 Pulaski St
- 113 W Taylor St
- 219 Waterloo St
- 316 S Military Ave
- 0 Stewart St
- 215 Depot St
- 108 Buffalo Rd
- 511 S Locust Ave
- 0 Woodland Dr Unit RTC2772580
- 409 N Military Ave
- 220 Jackson Ave
- 220 Lafayette Ave
- 222 Groh St
- 336 Jackson Ave
- 513 Parrish St
- 209 Frank St
- 330 Cocke St
- 426 Frank St
- 802 Mahr Ave
- 815 1st Ave
- 15 Public Square
- 9 Public Square
- 26 Public Square
- 201 Pulaski St
- 29 Public Square
- 1 Public Square
- 112 S Columbia Ave
- 208 Pulaski St
- 47 Public Square
- 104 N Military Ave
- 116 S Columbia Ave
- 106 N Military Ave
- 110 N Military Ave
- 42 Public Square
- 115 N Military Ave
- 214 Pulaski St
- 107 E Taylor St
- 124 S Columbia Ave
- 120 N Military Ave
- 216 Pulaski St