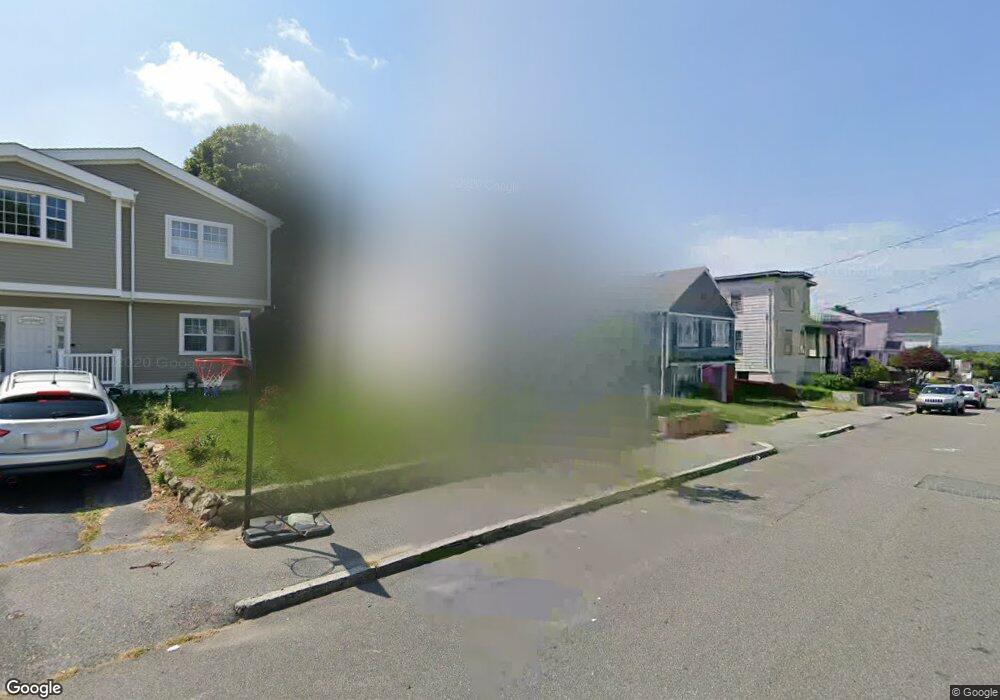
16 Rand St Revere, MA 02151
West Revere NeighborhoodEstimated Value: $608,000 - $673,601
3
Beds
2
Baths
1,404
Sq Ft
$460/Sq Ft
Est. Value
About This Home
This home is located at 16 Rand St, Revere, MA 02151 and is currently estimated at $645,650, approximately $459 per square foot. 16 Rand St is a home located in Suffolk County with nearby schools including Staff Sargent James J. Hill Elementary School, A.C. Whelan Elementary School, and Susan B. Anthony Middle School.
Ownership History
Date
Name
Owned For
Owner Type
Purchase Details
Closed on
Jul 20, 2020
Sold by
Prendergast John A
Bought by
Boston Empire Investments
Current Estimated Value
Home Financials for this Owner
Home Financials are based on the most recent Mortgage that was taken out on this home.
Original Mortgage
$245,000
Outstanding Balance
$217,250
Interest Rate
3.1%
Mortgage Type
Commercial
Estimated Equity
$428,400
Purchase Details
Closed on
Apr 19, 2016
Sold by
Martin Donna J
Bought by
Prendergast John A
Purchase Details
Closed on
Aug 27, 2014
Sold by
Prendergast John A
Bought by
Prendergast John A and Martin Donna J
Create a Home Valuation Report for This Property
The Home Valuation Report is an in-depth analysis detailing your home's value as well as a comparison with similar homes in the area
Home Values in the Area
Average Home Value in this Area
Purchase History
| Date | Buyer | Sale Price | Title Company |
|---|---|---|---|
| Boston Empire Investments | $240,000 | None Available | |
| Boston Empire Investments | $240,000 | None Available | |
| Boston Empire Investments | $240,000 | None Available | |
| Prendergast John A | -- | -- | |
| Prendergast John A | -- | -- | |
| Prendergast John A | -- | -- | |
| Prendergast John A | -- | -- | |
| Prendergast John A | -- | -- |
Source: Public Records
Mortgage History
| Date | Status | Borrower | Loan Amount |
|---|---|---|---|
| Open | Boston Empire Investments | $245,000 | |
| Closed | Boston Empire Investments | $245,000 |
Source: Public Records
Tax History Compared to Growth
Tax History
| Year | Tax Paid | Tax Assessment Tax Assessment Total Assessment is a certain percentage of the fair market value that is determined by local assessors to be the total taxable value of land and additions on the property. | Land | Improvement |
|---|---|---|---|---|
| 2025 | $5,463 | $602,300 | $285,200 | $317,100 |
| 2024 | $5,302 | $582,000 | $269,400 | $312,600 |
| 2023 | $5,039 | $529,900 | $225,000 | $304,900 |
| 2022 | $4,994 | $480,200 | $213,900 | $266,300 |
| 2021 | $4,698 | $424,800 | $198,100 | $226,700 |
| 2020 | $4,532 | $402,500 | $198,100 | $204,400 |
| 2019 | $4,410 | $364,200 | $180,600 | $183,600 |
| 2018 | $4,309 | $332,500 | $163,200 | $169,300 |
| 2017 | $4,168 | $297,900 | $142,600 | $155,300 |
| 2016 | $3,757 | $260,000 | $129,900 | $130,100 |
| 2015 | $3,848 | $260,000 | $129,900 | $130,100 |
Source: Public Records
Map
Nearby Homes