L
Landlord's Agent in 2025
Lauren Calero
RE/MAX
(630) 420-1220
4 in this area
99 Total Sales


Estimated Value: $616,741 - $681,000
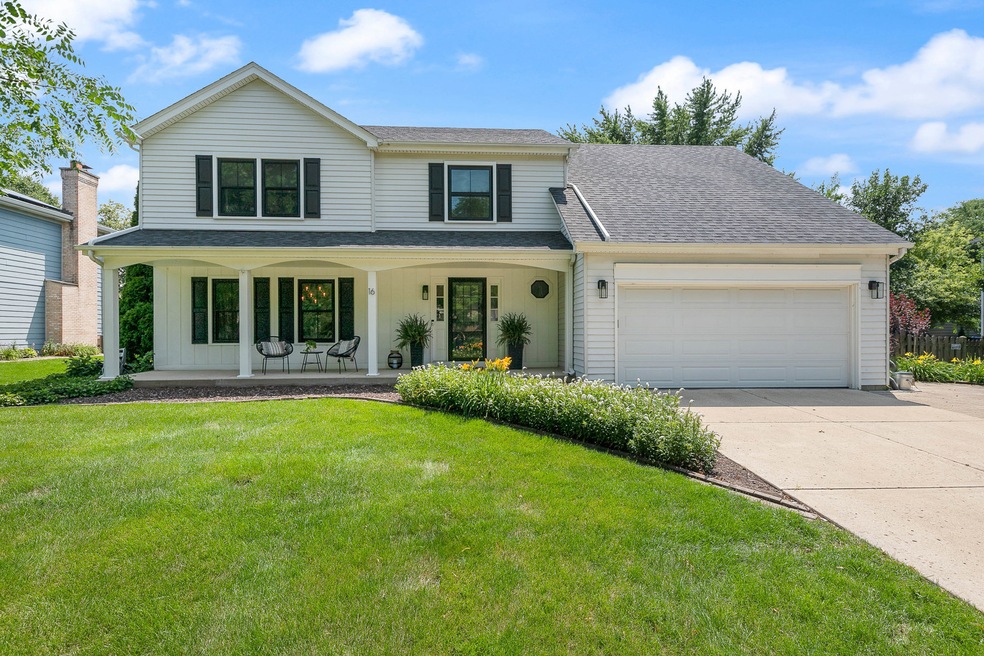
BEAUTIFULLY UPDATED HOME IN POPULAR MAPLEBROOK SUBDIVISION! Impeccably updated in today's modern colors and design. High end vinyl waterproof flooring through out main level. All new white trim through out main level and gorgeous updated half bathroom. Freshly painted! Large kitchen with plenty of cabinet space and granite counter tops. Backyard is a perfect quiet oasis, mature landscaping, fully fenced with relaxing koi pond. Four large bedrooms upstairs. New carpet. Full basement for storage. Epoxy two car garage! District 203 schools! Perfect location, only minutes to downtown Naperville, restaurants and shopping! Can be rented partially furnished.
Last Agent to Rent the Property
RE/MAX of Naperville License #475166469 Listed on: 02/21/2025

Co-Listed By
Mike Lenz
RE/MAX of Naperville License #475133465
| Date | Buyer | Sale Price | Title Company |
|---|---|---|---|
| Cedeno Elise | $450,000 | Old Republic Title |
| Date | Status | Borrower | Loan Amount |
|---|---|---|---|
| Open | Cedeno Elise | $427,500 |
| Date | Event | Price | List to Sale | Price per Sq Ft | Prior Sale |
|---|---|---|---|---|---|
| 04/16/2025 04/16/25 | Rented | $4,000 | 0.0% | -- | |
| 03/16/2025 03/16/25 | Off Market | $4,000 | -- | -- | |
| 03/08/2025 03/08/25 | For Rent | $4,000 | 0.0% | -- | |
| 03/01/2025 03/01/25 | Under Contract | -- | -- | -- | |
| 02/26/2025 02/26/25 | For Rent | $4,000 | -2.4% | -- | |
| 08/27/2023 08/27/23 | Rented | $4,100 | +2.5% | -- | |
| 08/01/2023 08/01/23 | Under Contract | -- | -- | -- | |
| 07/18/2023 07/18/23 | For Rent | $4,000 | 0.0% | -- | |
| 06/01/2021 06/01/21 | Sold | $450,000 | +4.7% | $161 / Sq Ft | View Prior Sale |
| 03/29/2021 03/29/21 | Pending | -- | -- | -- | |
| 03/22/2021 03/22/21 | For Sale | $430,000 | -- | $154 / Sq Ft |
| Year | Tax Paid | Tax Assessment Tax Assessment Total Assessment is a certain percentage of the fair market value that is determined by local assessors to be the total taxable value of land and additions on the property. | Land | Improvement |
|---|---|---|---|---|
| 2024 | $9,557 | $172,003 | $70,059 | $101,944 |
| 2023 | $9,161 | $156,980 | $63,940 | $93,040 |
| 2022 | $8,819 | $147,260 | $59,980 | $87,280 |
| 2021 | $8,483 | $141,690 | $57,710 | $83,980 |
| 2020 | $8,619 | $139,140 | $56,670 | $82,470 |
| 2019 | $8,367 | $133,120 | $54,220 | $78,900 |
| 2018 | $7,777 | $124,120 | $52,390 | $71,730 |
| 2017 | $7,619 | $119,930 | $50,620 | $69,310 |
| 2016 | $7,465 | $115,590 | $48,790 | $66,800 |
| 2015 | $7,415 | $108,860 | $45,950 | $62,910 |
| 2014 | $7,125 | $101,730 | $42,940 | $58,790 |
| 2013 | $7,018 | $101,970 | $43,040 | $58,930 |
L
Landlord's Agent in 2025
Lauren Calero
RE/MAX
(630) 420-1220
4 in this area
99 Total Sales
M
Landlord's Co-Listing Agent in 2025
Mike Lenz
RE/MAX
Tenant's Agent in 2025
Alexa Wagner
RE/MAX
(630) 460-6256
102 Total Sales
Seller's Agent in 2021
Cynthia Potilechio
Keller Williams Infinity
(630) 778-5800
3 in this area
132 Total Sales
Seller Co-Listing Agent in 2021
Dan Potilechio
Keller Williams Infinity
(630) 660-1741
1 in this area
70 Total Sales
M
Buyer's Agent in 2021
Michael Lenz
RE/MAX
Source: Midwest Real Estate Data (MRED)
MLS Number: 12289007
APN: 08-31-214-028
Disclaimer: Certain information contained herein is derived from information provided by parties other than Homes.com. All information provided is deemed reliable, but is not guaranteed to be accurate and should be independently verified.
![]() Based on information submitted to the MLS GRID. All data is obtained from various sources and may not have been verified by broker or MLS GRID. Supplied Open House Information is subject to change without notice. All information should be independently reviewed and verified for accuracy. Properties may or may not be listed by the office/agent presenting the information. Some IDX listings have been excluded from this website.
Based on information submitted to the MLS GRID. All data is obtained from various sources and may not have been verified by broker or MLS GRID. Supplied Open House Information is subject to change without notice. All information should be independently reviewed and verified for accuracy. Properties may or may not be listed by the office/agent presenting the information. Some IDX listings have been excluded from this website.
Based on information submitted to the MLS GRID
Ask me questions while you tour the home.