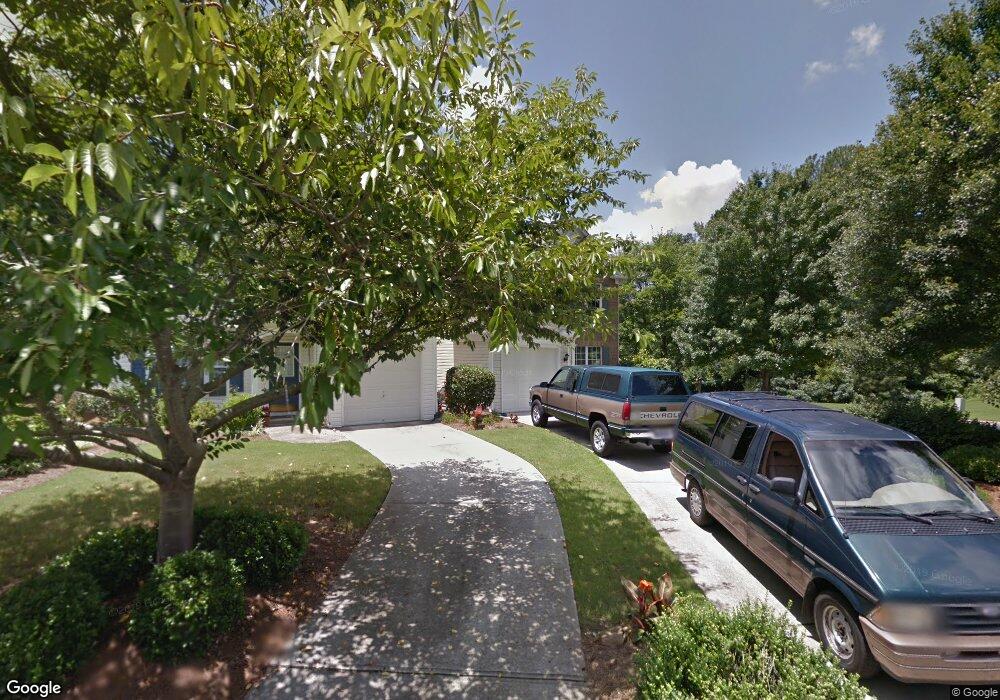
16 Regency Rd Unit 16 Alpharetta, GA 30022
Estimated Value: $375,000 - $398,000
2
Beds
3
Baths
1,449
Sq Ft
$267/Sq Ft
Est. Value
About This Home
This home is located at 16 Regency Rd Unit 16, Alpharetta, GA 30022 and is currently estimated at $386,588, approximately $266 per square foot. 16 Regency Rd Unit 16 is a home located in Fulton County with nearby schools including Hillside Elementary School, Holcomb Bridge Middle School, and Centennial High School.
Ownership History
Date
Name
Owned For
Owner Type
Purchase Details
Closed on
Jul 27, 2015
Sold by
Kennedy Sadie
Bought by
Burkhart Brandie L
Current Estimated Value
Home Financials for this Owner
Home Financials are based on the most recent Mortgage that was taken out on this home.
Original Mortgage
$148,000
Outstanding Balance
$116,441
Interest Rate
4.04%
Mortgage Type
New Conventional
Estimated Equity
$270,147
Purchase Details
Closed on
Aug 30, 2013
Sold by
Burkhart Brandie L
Bought by
Burkhart Brandie L and Kennedy John
Home Financials for this Owner
Home Financials are based on the most recent Mortgage that was taken out on this home.
Original Mortgage
$161,000
Interest Rate
4.39%
Mortgage Type
New Conventional
Purchase Details
Closed on
Aug 16, 2013
Sold by
Alexander Genice Paige
Bought by
Burkhart Brandie L and Kennedy Sadie
Home Financials for this Owner
Home Financials are based on the most recent Mortgage that was taken out on this home.
Original Mortgage
$161,000
Interest Rate
4.39%
Mortgage Type
New Conventional
Create a Home Valuation Report for This Property
The Home Valuation Report is an in-depth analysis detailing your home's value as well as a comparison with similar homes in the area
Home Values in the Area
Average Home Value in this Area
Purchase History
| Date | Buyer | Sale Price | Title Company |
|---|---|---|---|
| Burkhart Brandie L | -- | -- | |
| Burkhart Brandie L | -- | -- | |
| Burkhart Brandie L | $160,000 | -- |
Source: Public Records
Mortgage History
| Date | Status | Borrower | Loan Amount |
|---|---|---|---|
| Open | Burkhart Brandie L | $148,000 | |
| Previous Owner | Burkhart Brandie L | $161,000 |
Source: Public Records
Tax History Compared to Growth
Tax History
| Year | Tax Paid | Tax Assessment Tax Assessment Total Assessment is a certain percentage of the fair market value that is determined by local assessors to be the total taxable value of land and additions on the property. | Land | Improvement |
|---|---|---|---|---|
| 2025 | $409 | $139,720 | $23,360 | $116,360 |
| 2023 | $3,905 | $138,360 | $19,680 | $118,680 |
| 2022 | $1,320 | $120,960 | $17,840 | $103,120 |
| 2021 | $1,606 | $93,640 | $11,880 | $81,760 |
| 2020 | $1,623 | $87,800 | $11,800 | $76,000 |
| 2019 | $315 | $86,280 | $11,600 | $74,680 |
| 2018 | $1,434 | $71,840 | $9,040 | $62,800 |
| 2017 | $1,256 | $59,920 | $9,240 | $50,680 |
| 2016 | $1,248 | $59,920 | $9,240 | $50,680 |
| 2015 | $1,579 | $59,920 | $9,240 | $50,680 |
| 2014 | $981 | $44,760 | $9,720 | $35,040 |
Source: Public Records
Map
Nearby Homes
- 10 Regency Rd
- 222 Buckland Dr
- 2835 Shurburne Dr
- 51 Nesbit Place
- 31 Hall Manor
- 59 Townview Dr
- 9165 Nesbit Ferry Rd Unit 9
- 2895 Shurburne Dr
- 3 S Riversong Ln
- 1094 Township Square
- 1096 Township Square
- 9155 Nesbit Ferry Rd Unit 101
- 9155 Nesbit Ferry Rd Unit 96
- 555 S Riversong Ln
- 2640 Holcomb Springs Dr
- 3055 Rivermont Pkwy
- 930 Tiber Cir
- 425 Hackberry Ln
- 420 Hackberry Ct Unit 1
- 2930 Sawtooth Cir
- 16 Regency Rd
- 17 Regency Rd
- 18 Regency Rd
- 19 Regency Rd
- 20 Regency Rd
- 108 Devonshire Dr Unit 108
- 108 Devonshire Dr
- 15 Regency Rd
- 109 Devonshire Dr Unit 109
- 21 Devonshire Dr Unit 21
- 14 Regency Rd
- 110 Devonshire Dr
- 2.037 State Bridge Rd
- 111 Devonshire Dr
- 112 Devonshire Dr
- 13 Regency Rd
- 22 Regency Rd
- 113 Devonshire Dr
- 23 Regency Rd
- 12 Regency Rd Unit 12