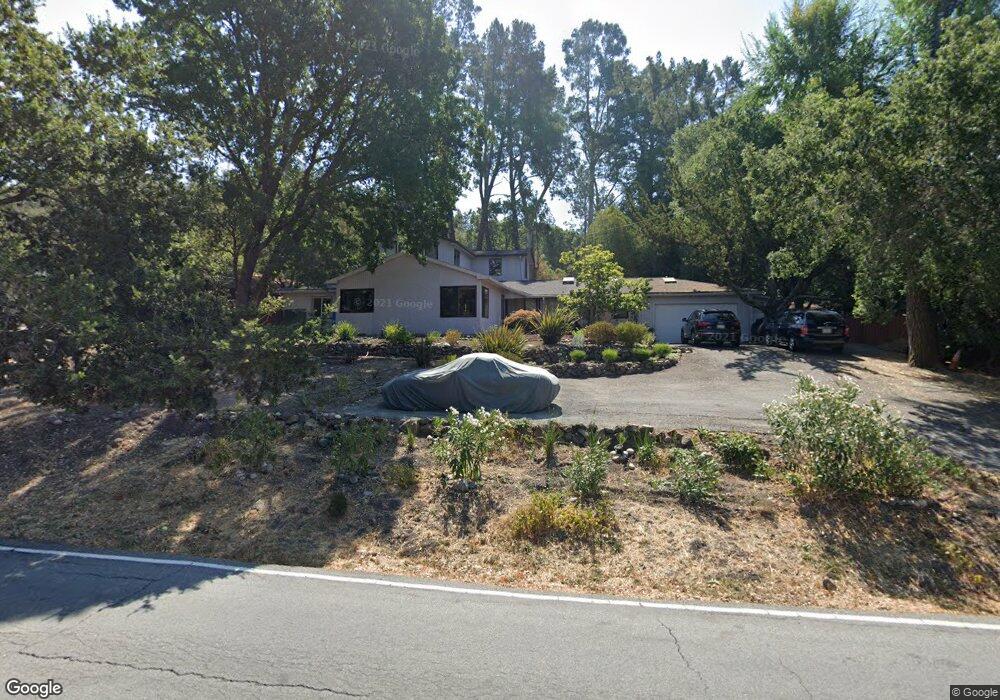
16 Rheem Blvd Orinda, CA 94563
Central Orinda NeighborhoodEstimated Value: $1,991,000 - $2,368,452
4
Beds
4
Baths
2,818
Sq Ft
$787/Sq Ft
Est. Value
About This Home
This home is located at 16 Rheem Blvd, Orinda, CA 94563 and is currently estimated at $2,218,363, approximately $787 per square foot. 16 Rheem Blvd is a home located in Contra Costa County with nearby schools including Glorietta Elementary School, Orinda Intermediate School, and Miramonte High School.
Ownership History
Date
Name
Owned For
Owner Type
Purchase Details
Closed on
Sep 13, 2016
Sold by
Syed Iqbal Areeb
Bought by
Iqbal Areeb Syed Revocable Trust
Current Estimated Value
Purchase Details
Closed on
Aug 26, 2016
Sold by
Syed Iqbal Areeb
Bought by
The Syed Family Trust
Purchase Details
Closed on
Mar 24, 2014
Sold by
Rose Nicole
Bought by
Syed Iqbal Areeb
Purchase Details
Closed on
Jun 16, 2009
Sold by
Rose Nicole
Bought by
Rose Nicole
Create a Home Valuation Report for This Property
The Home Valuation Report is an in-depth analysis detailing your home's value as well as a comparison with similar homes in the area
Home Values in the Area
Average Home Value in this Area
Purchase History
| Date | Buyer | Sale Price | Title Company |
|---|---|---|---|
| Iqbal Areeb Syed Revocable Trust | -- | None Available | |
| The Syed Family Trust | -- | None Available | |
| Syed Iqbal Areeb | -- | None Available | |
| Rose Nicole | -- | None Available |
Source: Public Records
Tax History Compared to Growth
Tax History
| Year | Tax Paid | Tax Assessment Tax Assessment Total Assessment is a certain percentage of the fair market value that is determined by local assessors to be the total taxable value of land and additions on the property. | Land | Improvement |
|---|---|---|---|---|
| 2025 | $8,411 | $566,476 | $208,096 | $358,380 |
| 2024 | $8,261 | $555,369 | $204,016 | $351,353 |
| 2023 | $8,261 | $544,480 | $200,016 | $344,464 |
| 2022 | $8,196 | $533,805 | $196,095 | $337,710 |
| 2021 | $8,012 | $523,339 | $192,250 | $331,089 |
| 2019 | $8,132 | $507,819 | $186,549 | $321,270 |
| 2018 | $7,588 | $497,863 | $182,892 | $314,971 |
| 2017 | $7,345 | $488,102 | $179,306 | $308,796 |
| 2016 | $7,229 | $478,533 | $175,791 | $302,742 |
| 2015 | $7,156 | $471,346 | $173,151 | $298,195 |
| 2014 | $6,955 | $462,114 | $169,760 | $292,354 |
Source: Public Records
Map
Nearby Homes