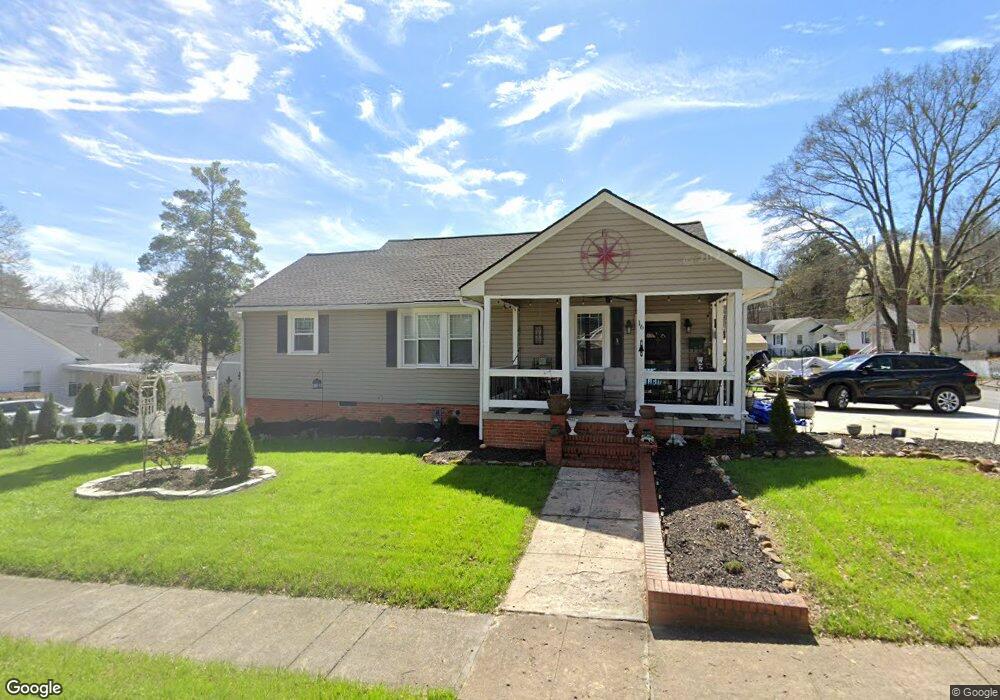
16 S 2nd St SE Lindale, GA 30147
Estimated Value: $136,000 - $218,000
--
Bed
1
Bath
2,238
Sq Ft
$71/Sq Ft
Est. Value
About This Home
This home is located at 16 S 2nd St SE, Lindale, GA 30147 and is currently estimated at $159,876, approximately $71 per square foot. 16 S 2nd St SE is a home located in Floyd County with nearby schools including Pepperell Middle School, Pepperell High School, and St. Mary School.
Ownership History
Date
Name
Owned For
Owner Type
Purchase Details
Closed on
Apr 21, 2016
Sold by
Dempsey Scott A
Bought by
Beach Christina
Current Estimated Value
Home Financials for this Owner
Home Financials are based on the most recent Mortgage that was taken out on this home.
Original Mortgage
$64,804
Outstanding Balance
$52,215
Interest Rate
3.62%
Mortgage Type
FHA
Estimated Equity
$104,639
Purchase Details
Closed on
Jun 28, 2002
Sold by
Westmoreland Van
Bought by
Dempsey Scott A
Purchase Details
Closed on
Jan 20, 1980
Sold by
Wood Dorothy R
Bought by
Westmoreland Glenda S
Purchase Details
Closed on
Dec 27, 1974
Sold by
Roberson Dan M
Bought by
Wood Dorothy R
Purchase Details
Closed on
Feb 21, 1974
Sold by
Roberson Mary Jane
Bought by
Roberson Dan M
Purchase Details
Closed on
Aug 18, 1967
Sold by
Roberson Jack L
Bought by
Roberson Mary Jane
Purchase Details
Closed on
Nov 30, 1964
Sold by
Clement James L
Bought by
Roberson Jack L
Purchase Details
Closed on
Jan 1, 1901
Bought by
Clement James L
Create a Home Valuation Report for This Property
The Home Valuation Report is an in-depth analysis detailing your home's value as well as a comparison with similar homes in the area
Home Values in the Area
Average Home Value in this Area
Purchase History
| Date | Buyer | Sale Price | Title Company |
|---|---|---|---|
| Beach Christina | $66,000 | -- | |
| Dempsey Scott A | $77,400 | -- | |
| Westmoreland Van | -- | -- | |
| Westmoreland Glenda S | $25,500 | -- | |
| Wood Dorothy R | $1,200,000 | -- | |
| Roberson Dan M | $14,000 | -- | |
| Roberson Mary Jane | -- | -- | |
| Roberson Jack L | $5,000 | -- | |
| Clement James L | -- | -- |
Source: Public Records
Mortgage History
| Date | Status | Borrower | Loan Amount |
|---|---|---|---|
| Open | Beach Christina | $64,804 |
Source: Public Records
Tax History Compared to Growth
Tax History
| Year | Tax Paid | Tax Assessment Tax Assessment Total Assessment is a certain percentage of the fair market value that is determined by local assessors to be the total taxable value of land and additions on the property. | Land | Improvement |
|---|---|---|---|---|
| 2024 | $1,187 | $39,736 | $6,266 | $33,470 |
| 2023 | $1,187 | $39,896 | $5,696 | $34,200 |
| 2022 | $1,036 | $33,175 | $4,557 | $28,618 |
| 2021 | $759 | $23,489 | $4,557 | $18,932 |
| 2020 | $703 | $21,562 | $3,418 | $18,144 |
| 2019 | $667 | $20,728 | $3,418 | $17,310 |
| 2018 | $633 | $19,638 | $3,418 | $16,220 |
| 2017 | $623 | $19,244 | $3,418 | $15,826 |
| 2016 | $687 | $24,277 | $3,400 | $20,877 |
| 2015 | $675 | $24,277 | $3,400 | $20,877 |
| 2014 | $675 | $24,277 | $3,400 | $20,877 |
Source: Public Records
Map
Nearby Homes
- 13 N Terrace Ave SE
- 0 S Edenfield Ridge Dr SE
- 612 Eden Valley Rd SE
- 305 Grove Ave SE
- 608 Eden Valley Rd SE
- 13 Hillside Ave
- 6 Hillside Ave SE
- 6 W Point Dr SE
- 113 Avenue D SE
- 12 Circle Dr SE
- 280 Ravenwood Dr SE
- 4 Club View Dr SE
- 413 Spring Village Rd SE
- 0 Club View Dr SE Unit 22344065
- 22 Club View Dr SE
- 0 Fullbright Dr SE Unit 7587938
- 0 Fullbright Dr SE Unit 10531900
- 792 Park Ave SE
- The Benson II Plan at Longbrooke
- 16 S 2nd St SE
- 14 S 2nd St SE
- 19 S 2nd Lindale St S
- 13 S 3rd St SE
- 18 S 2nd St SE
- 11 S 2nd St SE
- 11 S 3rd St SE
- 12 S 2nd St SE
- 9 S 2nd St SE
- 1 S Terrace Ave
- S S Terrace Ave
- 1 N Terrace Ave SE
- 1 N Terrace Ave SE
- 9 S 3rd St SE
- 7 S 2nd St SE
- 3 S Terrace Ave SE
- 16 S 3rd St SE
- 0 N Terrace Ave SE Unit 7444212
- 0 N Terrace Ave SE Unit 7382573
- 0 N Terrace Ave SE Unit 7357917