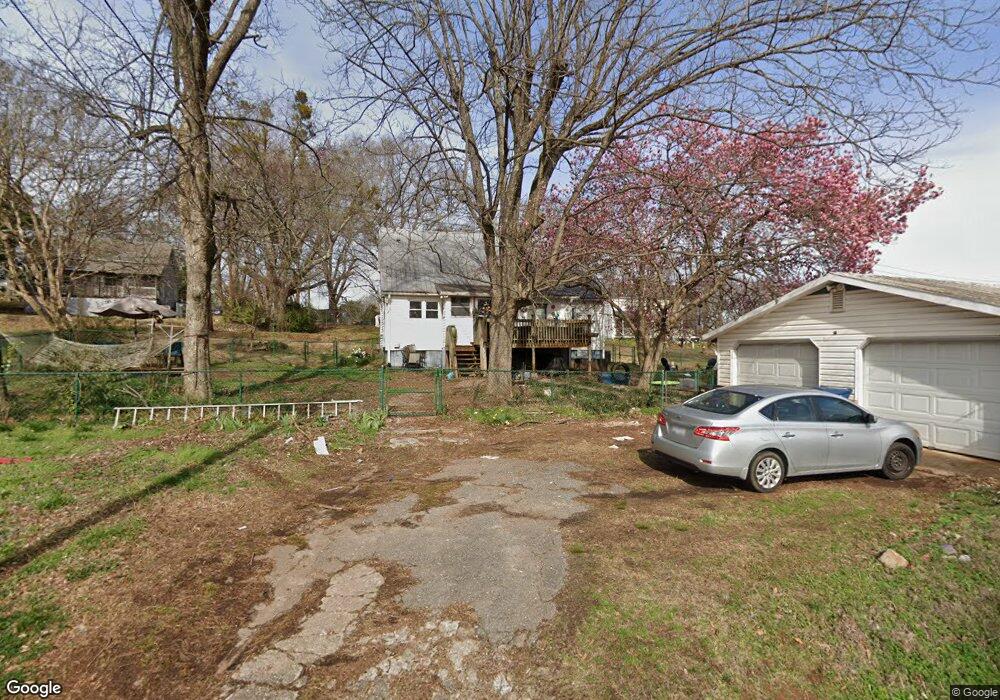
16 S Main St Startex, SC 29377
Estimated Value: $129,880 - $200,000
3
Beds
1
Bath
1,320
Sq Ft
$113/Sq Ft
Est. Value
About This Home
This home is located at 16 S Main St, Startex, SC 29377 and is currently estimated at $149,720, approximately $113 per square foot. 16 S Main St is a home with nearby schools including Duncan Elementary School, Byrnes Freshman Academy, and Beech Springs Intermediate School.
Ownership History
Date
Name
Owned For
Owner Type
Purchase Details
Closed on
Feb 14, 2024
Sold by
Douglas David
Bought by
Wiseley Caithlin E
Current Estimated Value
Home Financials for this Owner
Home Financials are based on the most recent Mortgage that was taken out on this home.
Original Mortgage
$76,206
Outstanding Balance
$59,462
Interest Rate
5.89%
Mortgage Type
Seller Take Back
Estimated Equity
$90,258
Purchase Details
Closed on
Mar 23, 2018
Sold by
Ruppe Joshua A
Bought by
Douglas David
Purchase Details
Closed on
Aug 16, 2016
Sold by
Douglas David
Bought by
Ruppe Joshua A
Home Financials for this Owner
Home Financials are based on the most recent Mortgage that was taken out on this home.
Original Mortgage
$82,500
Interest Rate
3.48%
Mortgage Type
Purchase Money Mortgage
Purchase Details
Closed on
May 21, 2015
Sold by
Turner Timothy R
Bought by
Douglas David
Create a Home Valuation Report for This Property
The Home Valuation Report is an in-depth analysis detailing your home's value as well as a comparison with similar homes in the area
Home Values in the Area
Average Home Value in this Area
Purchase History
| Date | Buyer | Sale Price | Title Company |
|---|---|---|---|
| Wiseley Caithlin E | $76,206 | None Listed On Document | |
| Douglas David | -- | None Available | |
| Ruppe Joshua A | $82,500 | None Available | |
| Douglas David | $15,000 | None Available |
Source: Public Records
Mortgage History
| Date | Status | Borrower | Loan Amount |
|---|---|---|---|
| Open | Wiseley Caithlin E | $76,206 | |
| Previous Owner | Ruppe Joshua A | $82,500 |
Source: Public Records
Tax History
| Year | Tax Paid | Tax Assessment Tax Assessment Total Assessment is a certain percentage of the fair market value that is determined by local assessors to be the total taxable value of land and additions on the property. | Land | Improvement |
|---|---|---|---|---|
| 2025 | $2,263 | $4,736 | $792 | $3,944 |
| 2024 | $2,263 | $6,341 | $1,060 | $5,281 |
| 2023 | $2,263 | $6,341 | $1,060 | $5,281 |
Source: Public Records
Map
Nearby Homes
- 6 S Main St Unit Ext
- 3 Elm St
- 179 Rosewood Cir
- 000 Wingo Rd
- 279 Finch Rd
- 100 Holly Dr
- 201 Knighton Dr
- 16 Ford Dr
- 326 Millbank Rd
- 1117 Syrah Ln
- 1212 N Pinot Rd
- 1321 S Pinot Rd
- 1313 S Pinot Rd
- 1325 S Pinot Rd
- 136 Moore St
- 290 Forest Lake Rd
- 296 Forest Lake Rd
- 00 Parker Ln
- 102 Kalkora Ct
- 387 Bright Farm Rd
Your Personal Tour Guide
Ask me questions while you tour the home.