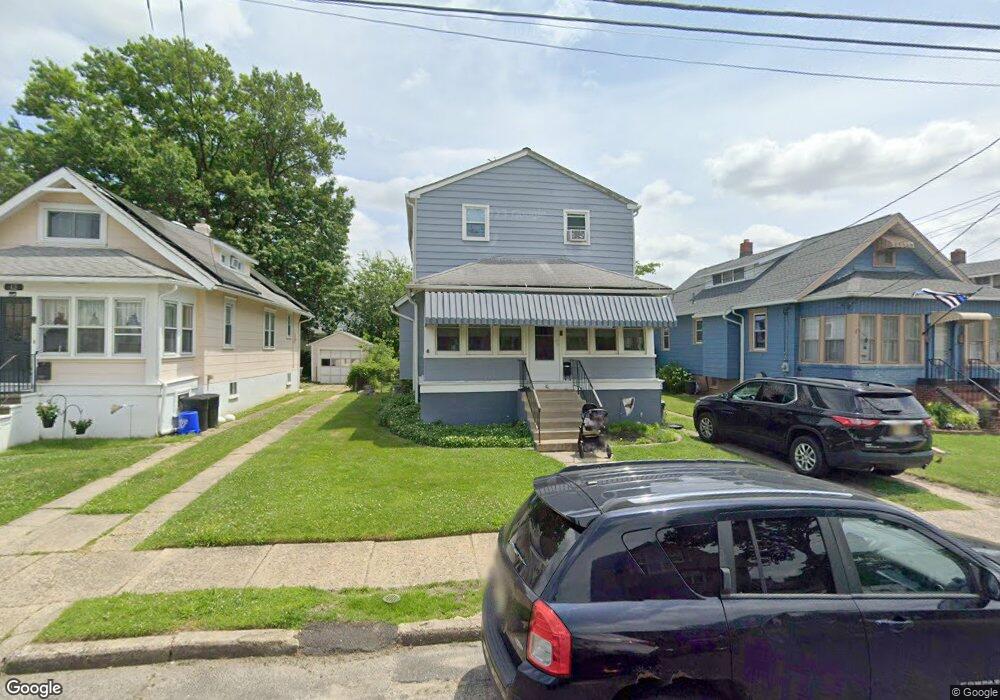
16 S Oak Ave Mount Ephraim, NJ 08059
Estimated Value: $248,999 - $354,000
--
Bed
--
Bath
1,596
Sq Ft
$201/Sq Ft
Est. Value
About This Home
This home is located at 16 S Oak Ave, Mount Ephraim, NJ 08059 and is currently estimated at $320,750, approximately $200 per square foot. 16 S Oak Ave is a home located in Camden County with nearby schools including Mary Bray Elementary School and Raymond W. Kershaw Elementary School.
Ownership History
Date
Name
Owned For
Owner Type
Purchase Details
Closed on
Apr 21, 2017
Sold by
Jones Frances K and Casey Christine
Bought by
Casey Michael R
Current Estimated Value
Home Financials for this Owner
Home Financials are based on the most recent Mortgage that was taken out on this home.
Original Mortgage
$137,464
Interest Rate
4.87%
Mortgage Type
FHA
Purchase Details
Closed on
Jan 30, 1991
Bought by
Jones Harry F and Jones Frances K
Create a Home Valuation Report for This Property
The Home Valuation Report is an in-depth analysis detailing your home's value as well as a comparison with similar homes in the area
Home Values in the Area
Average Home Value in this Area
Purchase History
| Date | Buyer | Sale Price | Title Company |
|---|---|---|---|
| Casey Michael R | $140,000 | Core Title | |
| Jones Harry F | $76,000 | -- |
Source: Public Records
Mortgage History
| Date | Status | Borrower | Loan Amount |
|---|---|---|---|
| Previous Owner | Casey Michael R | $137,464 |
Source: Public Records
Tax History Compared to Growth
Tax History
| Year | Tax Paid | Tax Assessment Tax Assessment Total Assessment is a certain percentage of the fair market value that is determined by local assessors to be the total taxable value of land and additions on the property. | Land | Improvement |
|---|---|---|---|---|
| 2025 | $7,723 | $147,800 | $36,900 | $110,900 |
| 2024 | $7,621 | $147,800 | $36,900 | $110,900 |
| 2023 | $7,621 | $147,800 | $36,900 | $110,900 |
| 2022 | $7,415 | $147,800 | $36,900 | $110,900 |
| 2021 | $7,208 | $147,800 | $36,900 | $110,900 |
| 2020 | $7,013 | $147,800 | $36,900 | $110,900 |
| 2019 | $6,886 | $147,800 | $36,900 | $110,900 |
| 2018 | $6,825 | $147,800 | $36,900 | $110,900 |
| 2017 | $6,725 | $147,800 | $36,900 | $110,900 |
| 2016 | $6,514 | $147,800 | $36,900 | $110,900 |
| 2015 | $6,289 | $147,800 | $36,900 | $110,900 |
| 2014 | $6,392 | $94,800 | $21,700 | $73,100 |
Source: Public Records
Map
Nearby Homes