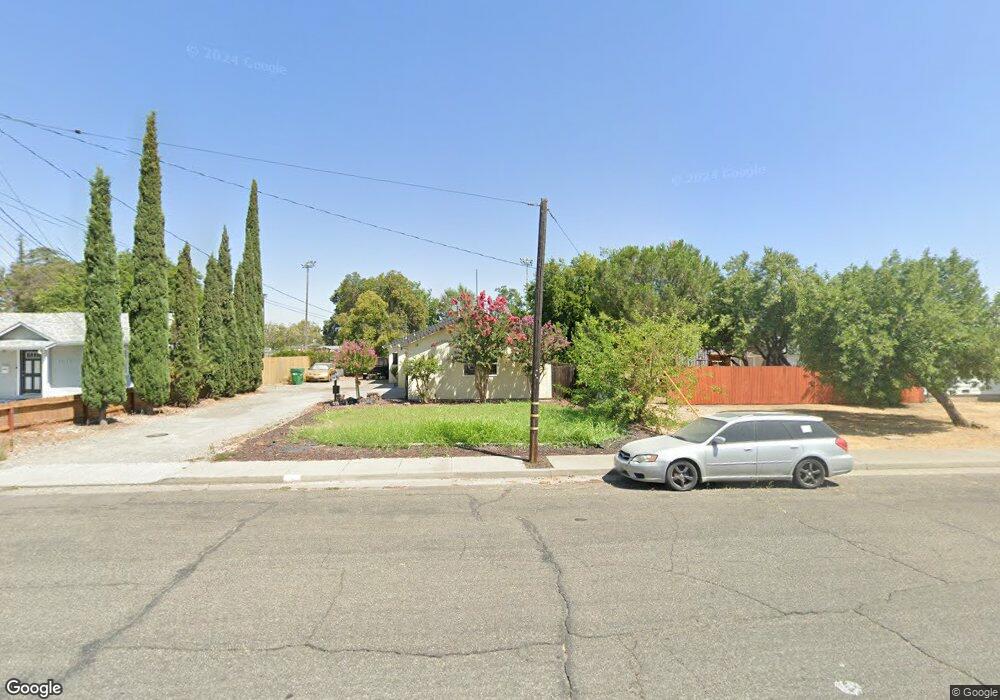
16 Shasta St Orland, CA 95963
Estimated Value: $92,000 - $283,000
2
Beds
1
Bath
896
Sq Ft
$245/Sq Ft
Est. Value
About This Home
This home is located at 16 Shasta St, Orland, CA 95963 and is currently estimated at $219,459, approximately $244 per square foot. 16 Shasta St is a home located in Glenn County with nearby schools including Mill Street Elementary School, Fairview Elementary School, and Price Intermediate School.
Ownership History
Date
Name
Owned For
Owner Type
Purchase Details
Closed on
Jun 3, 2010
Sold by
Shriners Hospitals For Children
Bought by
Mcintosh Robert L
Current Estimated Value
Home Financials for this Owner
Home Financials are based on the most recent Mortgage that was taken out on this home.
Original Mortgage
$79,212
Outstanding Balance
$53,296
Interest Rate
5.05%
Mortgage Type
FHA
Estimated Equity
$166,163
Purchase Details
Closed on
Sep 26, 2008
Sold by
Andres Allan A
Bought by
Shriners Hospitals For Children
Create a Home Valuation Report for This Property
The Home Valuation Report is an in-depth analysis detailing your home's value as well as a comparison with similar homes in the area
Home Values in the Area
Average Home Value in this Area
Purchase History
| Date | Buyer | Sale Price | Title Company |
|---|---|---|---|
| Mcintosh Robert L | $89,500 | Glenn County Title Company | |
| Shriners Hospitals For Children | -- | None Available |
Source: Public Records
Mortgage History
| Date | Status | Borrower | Loan Amount |
|---|---|---|---|
| Open | Mcintosh Robert L | $79,212 |
Source: Public Records
Tax History Compared to Growth
Tax History
| Year | Tax Paid | Tax Assessment Tax Assessment Total Assessment is a certain percentage of the fair market value that is determined by local assessors to be the total taxable value of land and additions on the property. | Land | Improvement |
|---|---|---|---|---|
| 2025 | $1,294 | $115,514 | $45,171 | $70,343 |
| 2024 | $1,294 | $113,250 | $44,286 | $68,964 |
| 2023 | $1,262 | $111,030 | $43,418 | $67,612 |
| 2022 | $1,241 | $108,854 | $42,567 | $66,287 |
| 2021 | $1,240 | $106,721 | $41,733 | $64,988 |
| 2020 | $1,240 | $105,628 | $41,306 | $64,322 |
| 2019 | $1,231 | $103,558 | $40,497 | $63,061 |
| 2018 | $1,152 | $101,528 | $39,703 | $61,825 |
| 2017 | $1,195 | $99,538 | $38,925 | $60,613 |
| 2016 | $1,123 | $97,587 | $38,162 | $59,425 |
| 2015 | $1,107 | $96,122 | $37,589 | $58,533 |
| 2014 | $1,086 | $94,240 | $36,853 | $57,387 |
Source: Public Records
Map
Nearby Homes