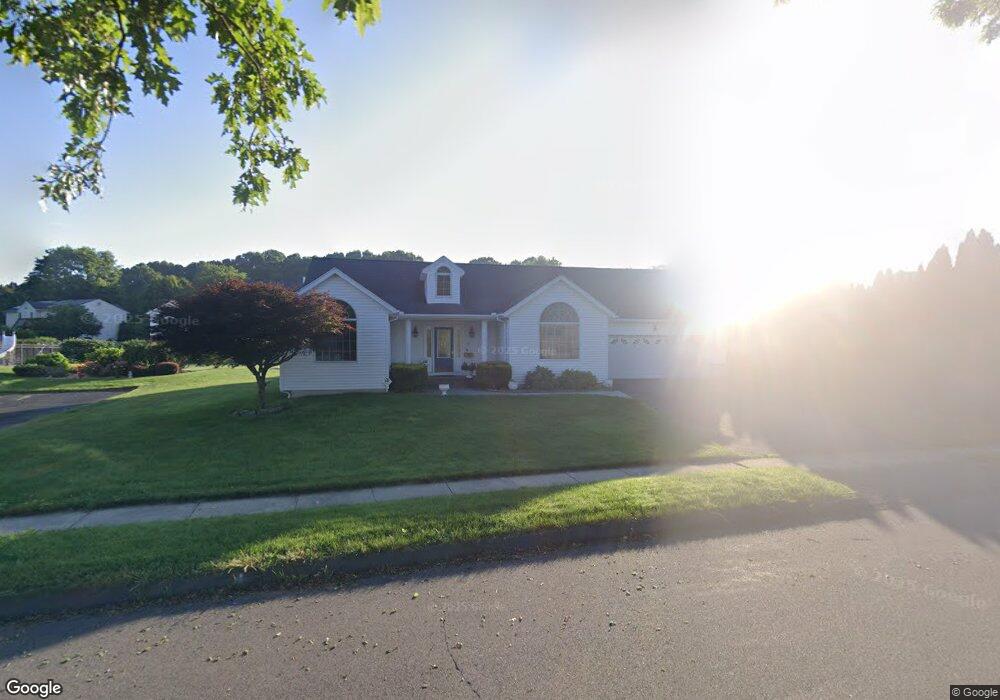
16 Sobin Dr Ansonia, CT 06401
Estimated Value: $461,000 - $509,096
3
Beds
2
Baths
1,962
Sq Ft
$250/Sq Ft
Est. Value
About This Home
This home is located at 16 Sobin Dr, Ansonia, CT 06401 and is currently estimated at $490,524, approximately $250 per square foot. 16 Sobin Dr is a home located in New Haven County with nearby schools including Ansonia Middle School, Ansonia High School, and St Mary & St Michael School.
Ownership History
Date
Name
Owned For
Owner Type
Purchase Details
Closed on
Aug 9, 1994
Sold by
Monaco Maureen E
Bought by
Boladz Henry W and Boladz Mary Jane
Current Estimated Value
Home Financials for this Owner
Home Financials are based on the most recent Mortgage that was taken out on this home.
Original Mortgage
$49,000
Interest Rate
9.38%
Mortgage Type
Unknown
Create a Home Valuation Report for This Property
The Home Valuation Report is an in-depth analysis detailing your home's value as well as a comparison with similar homes in the area
Home Values in the Area
Average Home Value in this Area
Purchase History
| Date | Buyer | Sale Price | Title Company |
|---|---|---|---|
| Boladz Henry W | $69,900 | -- |
Source: Public Records
Mortgage History
| Date | Status | Borrower | Loan Amount |
|---|---|---|---|
| Open | Boladz Henry W | $260,689 | |
| Closed | Boladz Henry W | $220,788 | |
| Closed | Boladz Henry W | $187,000 | |
| Closed | Boladz Henry W | $49,000 |
Source: Public Records
Tax History
| Year | Tax Paid | Tax Assessment Tax Assessment Total Assessment is a certain percentage of the fair market value that is determined by local assessors to be the total taxable value of land and additions on the property. | Land | Improvement |
|---|---|---|---|---|
| 2025 | $9,619 | $336,910 | $66,570 | $270,340 |
| 2024 | $8,925 | $336,910 | $66,570 | $270,340 |
| 2023 | $8,841 | $336,910 | $66,570 | $270,340 |
| 2022 | $8,471 | $224,100 | $66,900 | $157,200 |
| 2021 | $8,471 | $224,100 | $66,900 | $157,200 |
| 2020 | $8,471 | $224,100 | $66,900 | $157,200 |
| 2019 | $8,471 | $224,100 | $66,900 | $157,200 |
| 2018 | $8,363 | $224,100 | $66,900 | $157,200 |
| 2017 | $7,695 | $206,200 | $63,700 | $142,500 |
| 2016 | $7,695 | $206,200 | $63,700 | $142,500 |
| 2015 | $7,737 | $206,200 | $63,700 | $142,500 |
| 2014 | $7,961 | $206,200 | $63,700 | $142,500 |
| 2013 | $8,112 | $206,200 | $63,700 | $142,500 |
Source: Public Records
Map
Nearby Homes
Your Personal Tour Guide
Ask me questions while you tour the home.