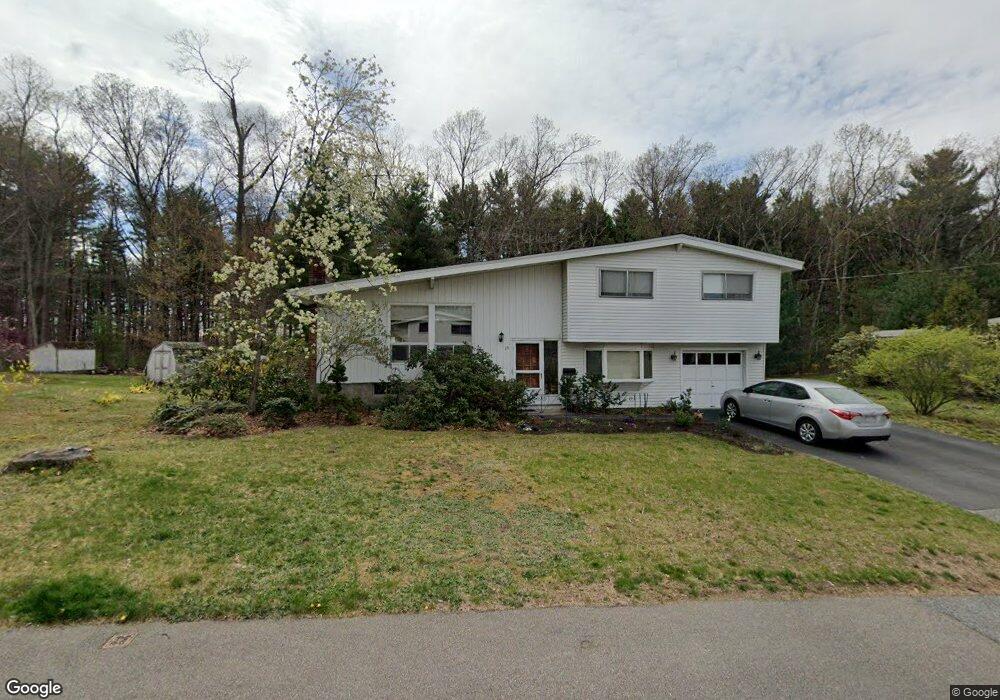
16 Spring Ln Framingham, MA 01701
Nobscot NeighborhoodEstimated Value: $675,000 - $780,000
3
Beds
3
Baths
1,200
Sq Ft
$588/Sq Ft
Est. Value
About This Home
This home is located at 16 Spring Ln, Framingham, MA 01701 and is currently estimated at $705,551, approximately $587 per square foot. 16 Spring Ln is a home located in Middlesex County with nearby schools including Framingham High School, MetroWest Jewish Day School, and Sudbury Valley School.
Ownership History
Date
Name
Owned For
Owner Type
Purchase Details
Closed on
Oct 28, 1997
Sold by
Gorman Raymond K and Gorman Rita S
Bought by
Kushner Nicholas N and Kushner Merle M
Current Estimated Value
Home Financials for this Owner
Home Financials are based on the most recent Mortgage that was taken out on this home.
Original Mortgage
$162,000
Outstanding Balance
$27,057
Interest Rate
7.48%
Mortgage Type
Purchase Money Mortgage
Estimated Equity
$678,494
Purchase Details
Closed on
Nov 22, 1996
Sold by
Phylis Suzanne M and Rier Janet M
Bought by
Swain Michael E and Swain Sandra J
Home Financials for this Owner
Home Financials are based on the most recent Mortgage that was taken out on this home.
Original Mortgage
$117,000
Interest Rate
7.81%
Mortgage Type
Purchase Money Mortgage
Create a Home Valuation Report for This Property
The Home Valuation Report is an in-depth analysis detailing your home's value as well as a comparison with similar homes in the area
Home Values in the Area
Average Home Value in this Area
Purchase History
| Date | Buyer | Sale Price | Title Company |
|---|---|---|---|
| Kushner Nicholas N | $212,000 | -- | |
| Kushner Nicholas N | $212,000 | -- | |
| Swain Michael E | $130,000 | -- | |
| Swain Michael E | $130,000 | -- |
Source: Public Records
Mortgage History
| Date | Status | Borrower | Loan Amount |
|---|---|---|---|
| Open | Swain Michael E | $162,000 | |
| Closed | Swain Michael E | $162,000 | |
| Previous Owner | Swain Michael E | $117,000 |
Source: Public Records
Tax History
| Year | Tax Paid | Tax Assessment Tax Assessment Total Assessment is a certain percentage of the fair market value that is determined by local assessors to be the total taxable value of land and additions on the property. | Land | Improvement |
|---|---|---|---|---|
| 2025 | $7,236 | $606,000 | $271,200 | $334,800 |
| 2024 | $7,080 | $568,200 | $242,200 | $326,000 |
| 2023 | $6,677 | $510,100 | $216,200 | $293,900 |
| 2022 | $6,301 | $458,600 | $196,200 | $262,400 |
| 2021 | $6,171 | $439,200 | $188,500 | $250,700 |
| 2020 | $6,163 | $411,400 | $171,300 | $240,100 |
| 2019 | $6,058 | $393,900 | $171,300 | $222,600 |
| 2018 | $5,944 | $364,200 | $164,900 | $199,300 |
| 2017 | $5,755 | $344,400 | $160,100 | $184,300 |
| 2016 | $5,826 | $335,200 | $160,100 | $175,100 |
| 2015 | $5,524 | $310,000 | $160,700 | $149,300 |
Source: Public Records
Map
Nearby Homes
Your Personal Tour Guide
Ask me questions while you tour the home.