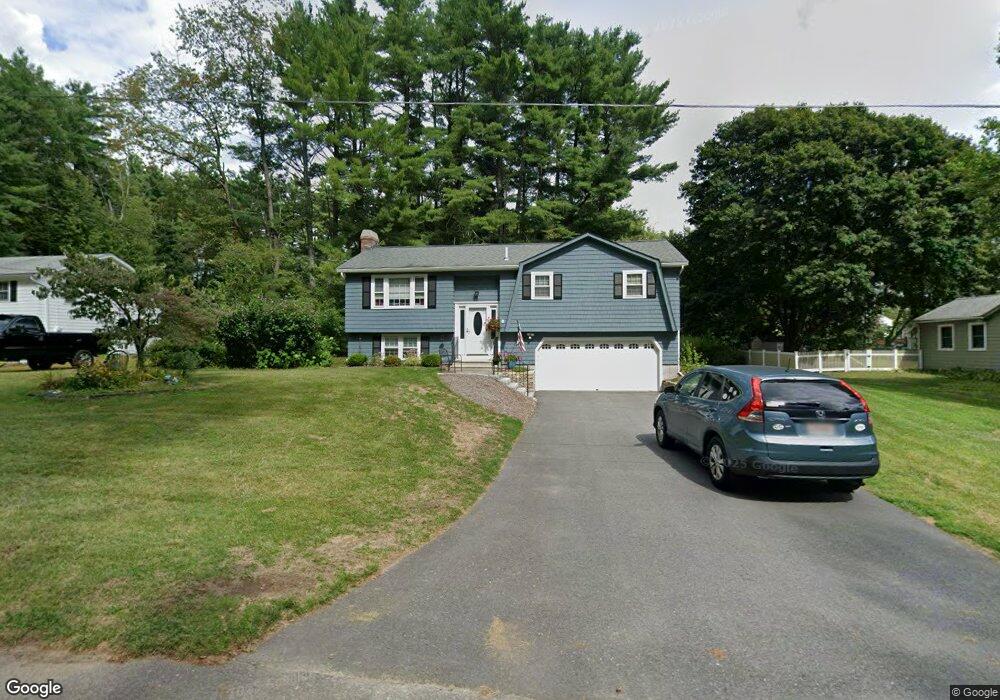
16 Spruce St Townsend, MA 01469
Estimated Value: $464,000 - $492,000
3
Beds
1
Bath
1,645
Sq Ft
$288/Sq Ft
Est. Value
About This Home
This home is located at 16 Spruce St, Townsend, MA 01469 and is currently estimated at $473,411, approximately $287 per square foot. 16 Spruce St is a home located in Middlesex County with nearby schools including North Middlesex Regional High School.
Ownership History
Date
Name
Owned For
Owner Type
Purchase Details
Closed on
Dec 28, 2016
Sold by
Dinicola Louis P and Dinicola Linda S
Bought by
Dinicola 2016 Ft and Dinicola
Current Estimated Value
Purchase Details
Closed on
Dec 22, 1975
Bought by
Dinicola Louis P and Dinicola Linda S
Create a Home Valuation Report for This Property
The Home Valuation Report is an in-depth analysis detailing your home's value as well as a comparison with similar homes in the area
Home Values in the Area
Average Home Value in this Area
Purchase History
| Date | Buyer | Sale Price | Title Company |
|---|---|---|---|
| Dinicola 2016 Ft | -- | -- | |
| Dinicola Louis P | $34,500 | -- |
Source: Public Records
Mortgage History
| Date | Status | Borrower | Loan Amount |
|---|---|---|---|
| Previous Owner | Dinicola Louis P | $7,600 | |
| Previous Owner | Dinicola Louis P | $25,000 | |
| Previous Owner | Dinicola Louis P | $25,000 |
Source: Public Records
Tax History
| Year | Tax Paid | Tax Assessment Tax Assessment Total Assessment is a certain percentage of the fair market value that is determined by local assessors to be the total taxable value of land and additions on the property. | Land | Improvement |
|---|---|---|---|---|
| 2025 | $5,417 | $373,100 | $91,700 | $281,400 |
| 2024 | $5,271 | $365,800 | $91,700 | $274,100 |
| 2023 | $4,837 | $317,000 | $79,200 | $237,800 |
| 2022 | $5,028 | $285,500 | $72,600 | $212,900 |
| 2021 | $4,824 | $263,200 | $71,700 | $191,500 |
| 2020 | $4,814 | $246,600 | $65,100 | $181,500 |
| 2019 | $4,508 | $233,200 | $65,100 | $168,100 |
| 2018 | $4,394 | $216,900 | $58,400 | $158,500 |
| 2017 | $4,170 | $212,000 | $61,300 | $150,700 |
| 2016 | $3,984 | $201,200 | $61,300 | $139,900 |
| 2015 | $3,732 | $195,300 | $68,000 | $127,300 |
| 2014 | $3,497 | $178,700 | $63,800 | $114,900 |
Source: Public Records
Map
Nearby Homes
- 18 Beech St
- 11 Maplewood Dr
- 7 Balsam Dr
- 45 Maplewood Dr
- 9 Birch Ln
- 8 South St
- 15 Squannacook Dr
- 4 Wilderness Way
- 4 Koski Way
- Lot 10 Christian Cir
- 8 Old Meetinghouse Rd
- 226 Cherry Tree Ln
- 18 Emery Rd
- 1 Depot Street Extension Unit 1
- 1 Depot Street Extension Unit 3
- 1 Depot Street Extension Unit 5
- 1 Depot Street Extension Unit 2
- 1 Depot Street Extension Unit 4
- 9 Spaulding Rd
- 21 Magnolia Ln
Your Personal Tour Guide
Ask me questions while you tour the home.