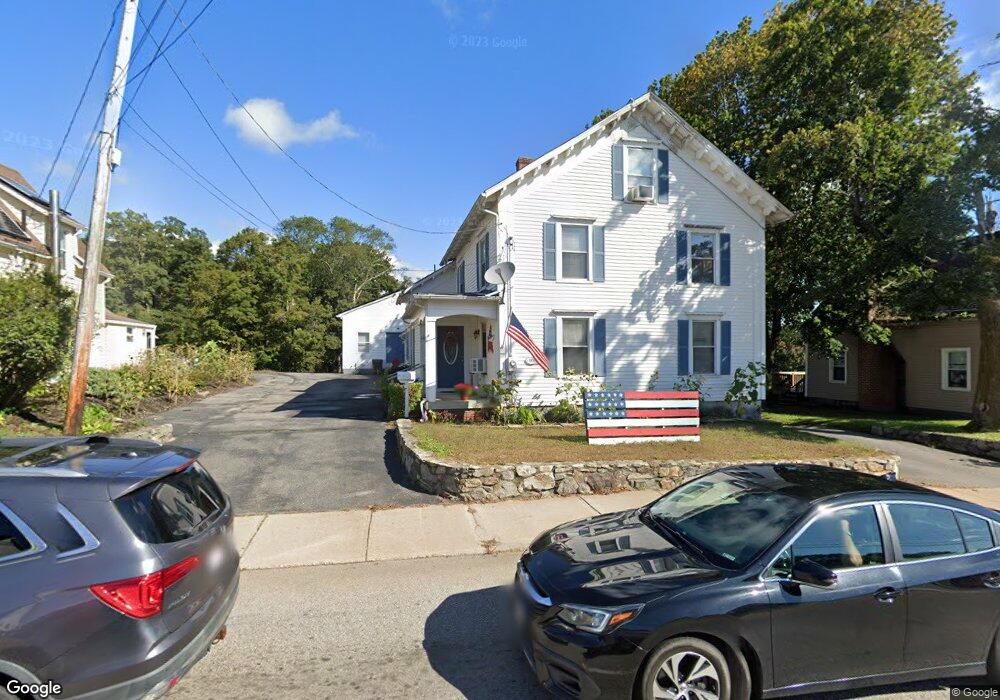
16 Sutton Ave Oxford, MA 01540
Estimated Value: $790,790
Studio
2
Baths
1,998
Sq Ft
$396/Sq Ft
Est. Value
About This Home
This home is located at 16 Sutton Ave, Oxford, MA 01540 and is currently estimated at $790,790, approximately $395 per square foot. 16 Sutton Ave is a home located in Worcester County with nearby schools including Alfred M Chaffee, Oxford High School, and Clara Barton Elementary School.
Ownership History
Date
Name
Owned For
Owner Type
Purchase Details
Closed on
Aug 18, 2000
Sold by
Dalio Michael J and Dalio Kathleen A
Bought by
Dalio Pamela M and Dalio Michael T
Current Estimated Value
Home Financials for this Owner
Home Financials are based on the most recent Mortgage that was taken out on this home.
Original Mortgage
$162,500
Interest Rate
8.13%
Mortgage Type
Commercial
Create a Home Valuation Report for This Property
The Home Valuation Report is an in-depth analysis detailing your home's value as well as a comparison with similar homes in the area
Home Values in the Area
Average Home Value in this Area
Purchase History
| Date | Buyer | Sale Price | Title Company |
|---|---|---|---|
| Dalio Pamela M | $250,000 | -- | |
| Dalio Pamela M | $250,000 | -- |
Source: Public Records
Mortgage History
| Date | Status | Borrower | Loan Amount |
|---|---|---|---|
| Open | Dalio Pamela M | $204,000 | |
| Closed | Dalio Pamela M | $162,500 |
Source: Public Records
Tax History
| Year | Tax Paid | Tax Assessment Tax Assessment Total Assessment is a certain percentage of the fair market value that is determined by local assessors to be the total taxable value of land and additions on the property. | Land | Improvement |
|---|---|---|---|---|
| 2025 | $0 | $500,200 | $109,100 | $391,100 |
| 2024 | $6,284 | $466,200 | $109,100 | $357,100 |
| 2023 | $6,640 | $486,800 | $105,400 | $381,400 |
| 2022 | $7,623 | $471,700 | $146,700 | $325,000 |
| 2021 | $7,387 | $446,900 | $146,700 | $300,200 |
| 2020 | $7,046 | $422,900 | $146,700 | $276,200 |
| 2019 | $5,167 | $303,400 | $91,700 | $211,700 |
| 2018 | $5,240 | $303,400 | $91,700 | $211,700 |
| 2017 | $5,250 | $311,600 | $85,800 | $225,800 |
| 2016 | $5,275 | $311,600 | $85,800 | $225,800 |
| 2015 | $4,920 | $311,600 | $85,800 | $225,800 |
| 2014 | $4,643 | $309,500 | $79,500 | $230,000 |
Source: Public Records
Map
Nearby Homes
Your Personal Tour Guide
Ask me questions while you tour the home.