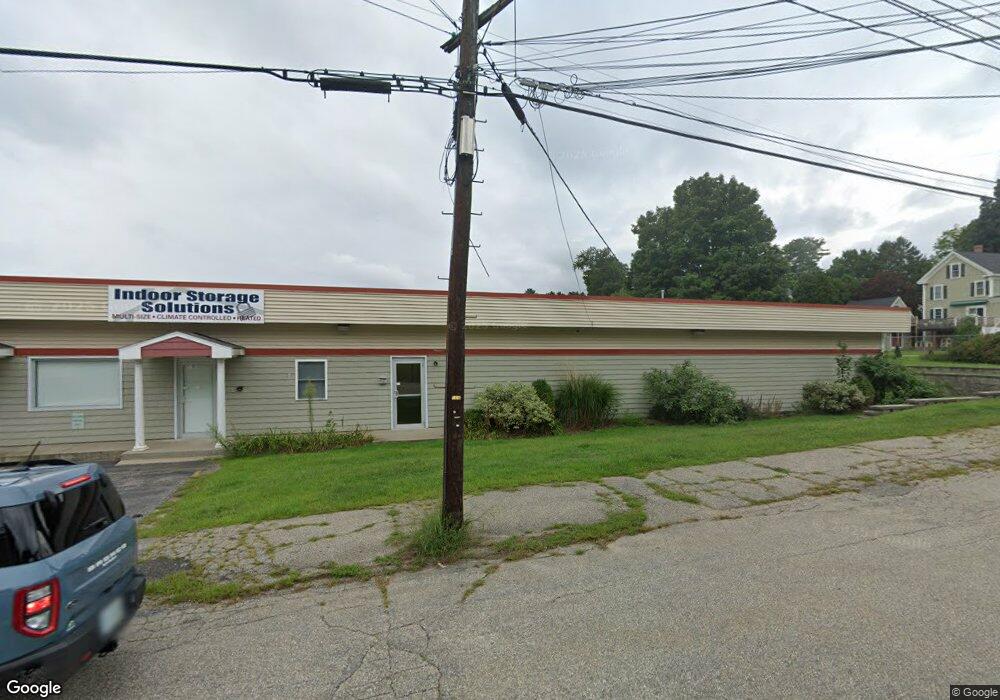
16 Swamscott St Newfields, NH 03856
Estimated Value: $6,151,792
Studio
3
Baths
116,000
Sq Ft
$53/Sq Ft
Est. Value
About This Home
This home is located at 16 Swamscott St, Newfields, NH 03856 and is currently estimated at $6,151,792, approximately $53 per square foot. 16 Swamscott St is a home located in Rockingham County with nearby schools including Newfields Elementary School, Cooperative Middle School, and Exeter High School.
Ownership History
Date
Name
Owned For
Owner Type
Purchase Details
Closed on
Mar 1, 2023
Sold by
Oneil Warehouse Co Llc
Bought by
16 Swamscott Street Llc
Current Estimated Value
Purchase Details
Closed on
Sep 23, 2009
Sold by
Newbrook Inc and G & G Llc
Bought by
Oneil Warehouse Co Llc
Home Financials for this Owner
Home Financials are based on the most recent Mortgage that was taken out on this home.
Original Mortgage
$1,000,000
Interest Rate
5.31%
Mortgage Type
Commercial
Create a Home Valuation Report for This Property
The Home Valuation Report is an in-depth analysis detailing your home's value as well as a comparison with similar homes in the area
Home Values in the Area
Average Home Value in this Area
Purchase History
| Date | Buyer | Sale Price | Title Company |
|---|---|---|---|
| 16 Swamscott Street Llc | $5,150,000 | None Available | |
| Oneil Warehouse Co Llc | $550,100 | -- |
Source: Public Records
Mortgage History
| Date | Status | Borrower | Loan Amount |
|---|---|---|---|
| Previous Owner | Oneil Warehouse Co Llc | $450,000 | |
| Previous Owner | Oneil Warehouse Co Llc | $1,000,000 | |
| Previous Owner | Oneil Warehouse Co Llc | $700,000 |
Source: Public Records
Tax History
| Year | Tax Paid | Tax Assessment Tax Assessment Total Assessment is a certain percentage of the fair market value that is determined by local assessors to be the total taxable value of land and additions on the property. | Land | Improvement |
|---|---|---|---|---|
| 2025 | $86,548 | $5,106,100 | $1,022,200 | $4,083,900 |
| 2024 | $82,157 | $5,106,100 | $1,022,200 | $4,083,900 |
| 2023 | $80,625 | $5,106,100 | $1,022,200 | $4,083,900 |
| 2022 | $43,238 | $2,062,900 | $607,300 | $1,455,600 |
| 2021 | $42,393 | $2,062,900 | $607,300 | $1,455,600 |
| 2020 | $43,816 | $2,062,900 | $607,300 | $1,455,600 |
| 2019 | $42,475 | $2,062,900 | $607,300 | $1,455,600 |
| 2018 | $40,949 | $2,062,900 | $607,300 | $1,455,600 |
| 2017 | $40,763 | $1,702,700 | $607,600 | $1,095,100 |
| 2016 | $39,537 | $1,702,700 | $607,600 | $1,095,100 |
| 2015 | $39,213 | $1,702,700 | $607,600 | $1,095,100 |
| 2014 | $41,290 | $1,702,700 | $607,600 | $1,095,100 |
| 2013 | $41,342 | $1,702,700 | $607,600 | $1,095,100 |
Source: Public Records
Map
Nearby Homes
- 3 Swamscott St
- 57 Main St
- 100 Exeter Rd
- 85 College Rd
- 10 Wingate Ct
- 74 College Rd
- 23 Winding Brook Dr
- 9 Captain's Way
- 00 Piscassic & Oaklands Rd Unit 1
- 3 Chisholm Farm Dr
- 1 Firefly Landing
- 14 Doe Run Ln
- 5 Stone Ridge Ln
- 222 Portsmouth Ave
- 0 Autumn Ln
- 32 Tansy Ave
- 5 Ridge Rd
- 1 Jason Dr
- 0 Pear Tree Ln Unit 9
- 0 Pear Tree Ln Unit 10
- 14 Swamscott St
- 19 Pleasant St
- 17 Pleasant St
- 25 Pleasant St
- 15 Swamscott St
- 15 Swamscott St Unit 2
- 19 Swamscott St
- 34 Railroad Ave
- 20 Pleasant St
- 13 Swamscott St
- 33 Railroad Ave
- 18 Pleasant St
- 24 Pleasant St
- 17 Swamscott St
- 3 Depot St
- 26 Pleasant St
- 4 River Rd
- 28 Pleasant St
- 10 Swamscott St
- 27 Railroad Ave
Your Personal Tour Guide
Ask me questions while you tour the home.