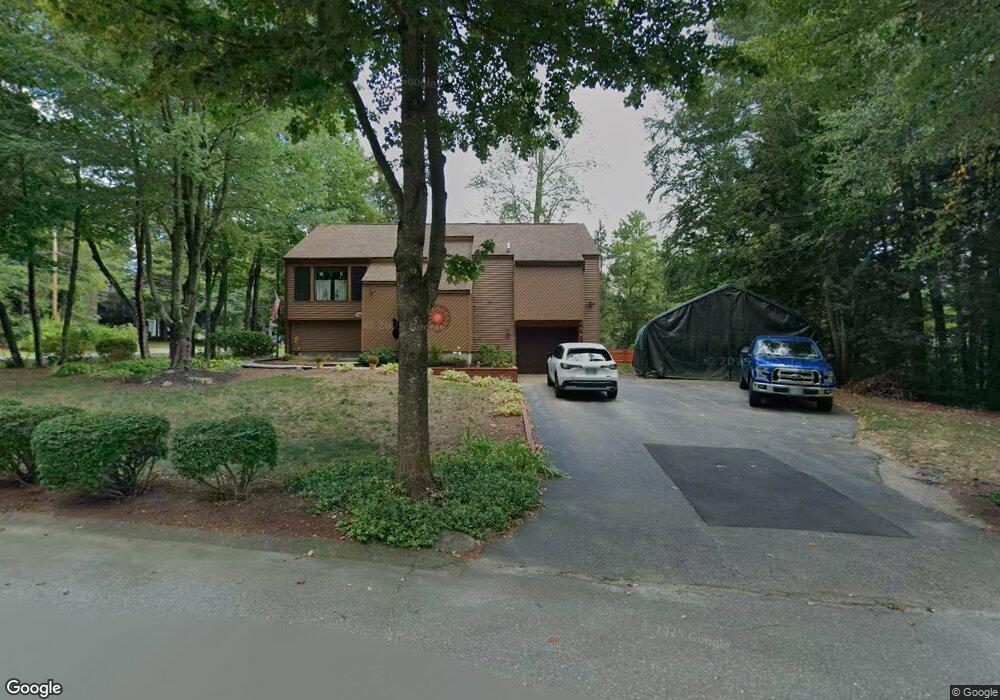
16 Sycamore Rd Milford, NH 03055
Estimated Value: $479,000 - $491,000
3
Beds
2
Baths
1,179
Sq Ft
$412/Sq Ft
Est. Value
About This Home
This home is located at 16 Sycamore Rd, Milford, NH 03055 and is currently estimated at $486,056, approximately $412 per square foot. 16 Sycamore Rd is a home with nearby schools including Jacques Memorial Elementary School, Heron Pond Elementary School, and Milford Middle School.
Ownership History
Date
Name
Owned For
Owner Type
Purchase Details
Closed on
Oct 16, 2001
Sold by
Whitson Karl D and Whitson Jennifer L
Bought by
Manoli John S
Current Estimated Value
Home Financials for this Owner
Home Financials are based on the most recent Mortgage that was taken out on this home.
Original Mortgage
$45,000
Outstanding Balance
$17,666
Interest Rate
6.93%
Estimated Equity
$468,390
Purchase Details
Closed on
Jun 2, 1997
Sold by
Lanoue John and Lanoue Danielle
Bought by
Whitson Karl D and Whitson Jennifer L
Home Financials for this Owner
Home Financials are based on the most recent Mortgage that was taken out on this home.
Original Mortgage
$104,400
Interest Rate
8.09%
Create a Home Valuation Report for This Property
The Home Valuation Report is an in-depth analysis detailing your home's value as well as a comparison with similar homes in the area
Home Values in the Area
Average Home Value in this Area
Purchase History
| Date | Buyer | Sale Price | Title Company |
|---|---|---|---|
| Manoli John S | $191,000 | -- | |
| Whitson Karl D | $109,900 | -- |
Source: Public Records
Mortgage History
| Date | Status | Borrower | Loan Amount |
|---|---|---|---|
| Open | Whitson Karl D | $45,000 | |
| Previous Owner | Whitson Karl D | $104,400 |
Source: Public Records
Tax History Compared to Growth
Tax History
| Year | Tax Paid | Tax Assessment Tax Assessment Total Assessment is a certain percentage of the fair market value that is determined by local assessors to be the total taxable value of land and additions on the property. | Land | Improvement |
|---|---|---|---|---|
| 2024 | $7,323 | $309,400 | $90,800 | $218,600 |
| 2023 | $6,859 | $309,400 | $90,800 | $218,600 |
| 2022 | $6,432 | $309,400 | $90,800 | $218,600 |
| 2021 | $6,234 | $309,400 | $90,800 | $218,600 |
| 2020 | $7,068 | $278,600 | $64,600 | $214,000 |
| 2019 | $3,501 | $278,600 | $64,600 | $214,000 |
| 2018 | $3,413 | $211,500 | $63,600 | $147,900 |
| 2017 | $2,649 | $211,500 | $63,600 | $147,900 |
| 2016 | $6,125 | $211,500 | $63,600 | $147,900 |
| 2015 | $5,712 | $200,000 | $63,600 | $136,400 |
| 2014 | $5,460 | $200,000 | $63,600 | $136,400 |
| 2013 | $5,386 | $199,700 | $63,600 | $136,100 |
Source: Public Records
Map
Nearby Homes
- 32 Larch Rd
- 0 Briar Cliff Dr
- 344 Elm St Unit 41
- 24 Spaulding St
- 131 Homestead Cir
- 229 Mont Vernon Rd
- 545 Elm St Unit 34
- 112 Union St
- 42 Quarry Cir
- 70 Quarry Cir
- 83 Patch Hill Ln
- 26 Melendy Rd Unit 97
- 160 Bridge St
- 254 Nashua St
- 64 Lyndeborough Rd
- 18 Souhegan St
- 179 Jennison Rd
- 58 North St
- 40 North St
- 14 North St