N
Landlord's Agent in 2026
Nicole Galiger
Park Real Estate Management
(919) 307-6242
2 Total Sales
Estimated Value: $451,000 - $524,000
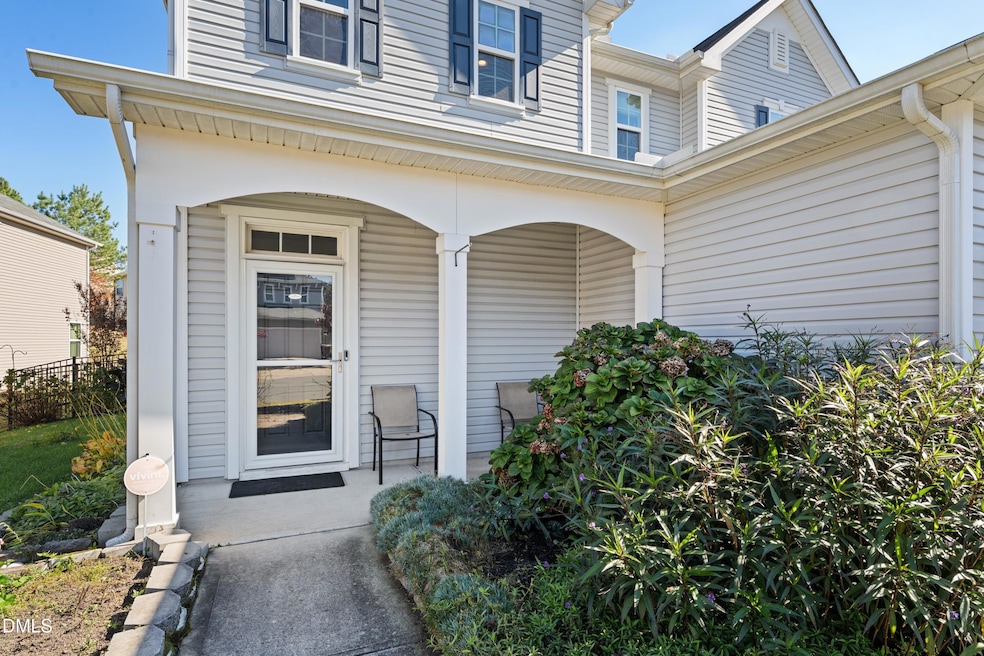
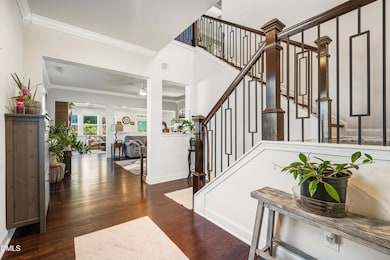
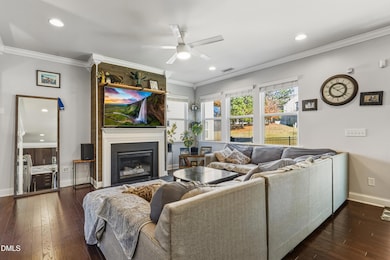
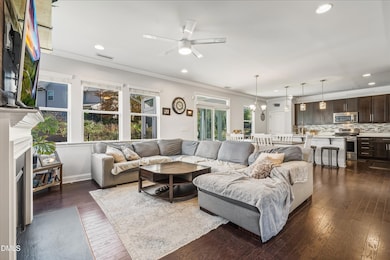
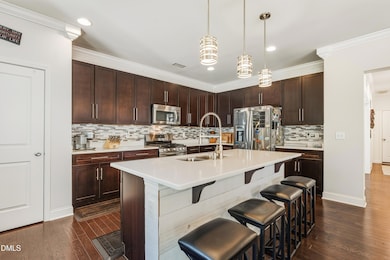
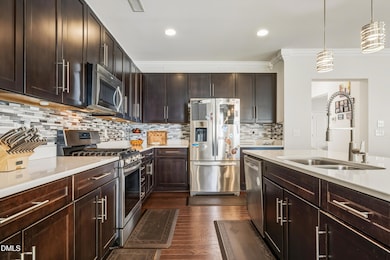
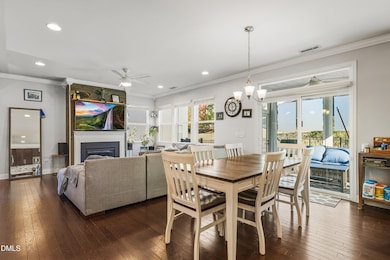
Stylish, open-concept home bathed in natural light — this property is truly a breath of fresh air! Step inside to find soaring 9-ft ceilings, rich hardwood floors, and a modern, open layout designed for both comfort and style. The chef-inspired kitchen features quartz countertops, a spacious island, stainless steel appliances, and plenty of cabinet space for all your cooking and entertaining needs. Upstairs, a versatile loft area offers the perfect flex space for a home office, media room, or play area. The elegant primary suite includes a tray ceiling, dual walk-in closets, and a spa-like bathroom with a garden tub, dual vanity, and premium finishes. Enjoy peaceful evenings on the screened porch overlooking the fully fenced backyard — perfect for relaxing, gardening, or hosting guests. The home also includes a washer and dryer for added convenience. With solar panels to help reduce utility costs, you'll enjoy both comfort and energy savings year-round. Tucked away on a quiet cul-de-sac, this home offers the ideal blend of privacy and accessibility — just minutes from Research Triangle Park (RTP), downtown Durham, Raleigh, and RDU Airport. Key Features: 3 Bedrooms / 2.5 Bathrooms (downstairs study can serve as a bedroom)
Open-concept layout with 9-ft ceilings & abundant natural light
Gourmet kitchen with quartz countertops & stainless steel appliances
Loft space ideal for office or entertainment
Primary suite with tray ceiling, dual walk-in closets & luxurious bath
Screened porch & fully fenced backyard
Solar panels for energy savings
Washer and dryer included
Quiet cul-de-sac location
Convenient to RTP, downtown Durham, Raleigh & RDU Airport This property is unfurnished and is offered for lease through Park Real Estate Management. Applicants must have 650+ credit score and income 3x the monthly lease rate in order to qualify. $75 application fee per applicant. $100 per adult tenant onboarding fee. We look forward to helping you find your next home!
Last Agent to Rent the Property
Park Real Estate Management License #289671 Listed on: 11/06/2025

Last Renter's Agent
Park Real Estate Management License #289671 Listed on: 11/06/2025
| Date | Buyer | Sale Price | Title Company |
|---|---|---|---|
| Capegsan Euan | -- | None Available | |
| Capegsan Euan | $295,000 | None Available | |
| Joof Awa Yombeh | $243,500 | None Available |
| Date | Status | Borrower | Loan Amount |
|---|---|---|---|
| Open | Capegsan Euan | $297,000 | |
| Previous Owner | Joof Awa Yombeh | $239,037 |
| Date | Event | Price | List to Sale | Price per Sq Ft |
|---|---|---|---|---|
| 01/07/2026 01/07/26 | Rented | $2,600 | 0.0% | -- |
| 12/19/2025 12/19/25 | Price Changed | $2,600 | -3.7% | $1 / Sq Ft |
| 12/03/2025 12/03/25 | Price Changed | $2,700 | -3.6% | $1 / Sq Ft |
| 11/06/2025 11/06/25 | For Rent | $2,800 | -- | -- |
| Year | Tax Paid | Tax Assessment Tax Assessment Total Assessment is a certain percentage of the fair market value that is determined by local assessors to be the total taxable value of land and additions on the property. | Land | Improvement |
|---|---|---|---|---|
| 2025 | $5,031 | $507,486 | $77,625 | $429,861 |
| 2024 | $4,117 | $295,137 | $45,800 | $249,337 |
| 2023 | $3,866 | $295,137 | $45,800 | $249,337 |
| 2022 | $3,777 | $295,137 | $45,800 | $249,337 |
| 2021 | $3,726 | $292,467 | $45,800 | $246,667 |
| 2020 | $3,638 | $292,467 | $45,800 | $246,667 |
| 2019 | $3,638 | $292,467 | $45,800 | $246,667 |
| 2018 | $3,508 | $258,612 | $45,800 | $212,812 |
| 2017 | $3,482 | $258,612 | $45,800 | $212,812 |
| 2016 | $3,365 | $258,612 | $45,800 | $212,812 |
| 2015 | $3,401 | $245,686 | $58,333 | $187,353 |
| 2014 | $3,401 | $245,686 | $58,333 | $187,353 |
N
Landlord's Agent in 2026
Nicole Galiger
Park Real Estate Management
(919) 307-6242
2 Total Sales
Source: Doorify MLS
MLS Number: 10131764
APN: 212618
Disclaimer: Certain information contained herein is derived from information provided by parties other than Homes.com. All information provided is deemed reliable, but is not guaranteed to be accurate and should be independently verified.
![]() Some IDX listings have been excluded from this IDX display. Brokers make an effort to deliver accurate information, but buyers should independently verify any information on which they will rely in a transaction. The listing broker shall not be responsible for any typographical errors, misinformation, or misprints, and they shall be held totally harmless from any damages arising from reliance upon this data. This data is provided exclusively for consumers’ personal, non-commercial use. Listings marked with an icon are provided courtesy of the Doorify MLS, Inc. of North Carolina, Internet Data Exchange Database. Closed (sold) listings may have been listed and/or sold by a real estate firm other than the firm(s) featured on this website. Closed data is not available until the sale of the property is recorded in the MLS. Home sale data is not an appraisal, CMA, competitive or comparative market analysis, or home valuation of any property. Copyright 2026 Doorify MLS, Inc. of North Carolina. All rights reserved.
Some IDX listings have been excluded from this IDX display. Brokers make an effort to deliver accurate information, but buyers should independently verify any information on which they will rely in a transaction. The listing broker shall not be responsible for any typographical errors, misinformation, or misprints, and they shall be held totally harmless from any damages arising from reliance upon this data. This data is provided exclusively for consumers’ personal, non-commercial use. Listings marked with an icon are provided courtesy of the Doorify MLS, Inc. of North Carolina, Internet Data Exchange Database. Closed (sold) listings may have been listed and/or sold by a real estate firm other than the firm(s) featured on this website. Closed data is not available until the sale of the property is recorded in the MLS. Home sale data is not an appraisal, CMA, competitive or comparative market analysis, or home valuation of any property. Copyright 2026 Doorify MLS, Inc. of North Carolina. All rights reserved.
Ask me questions while you tour the home.