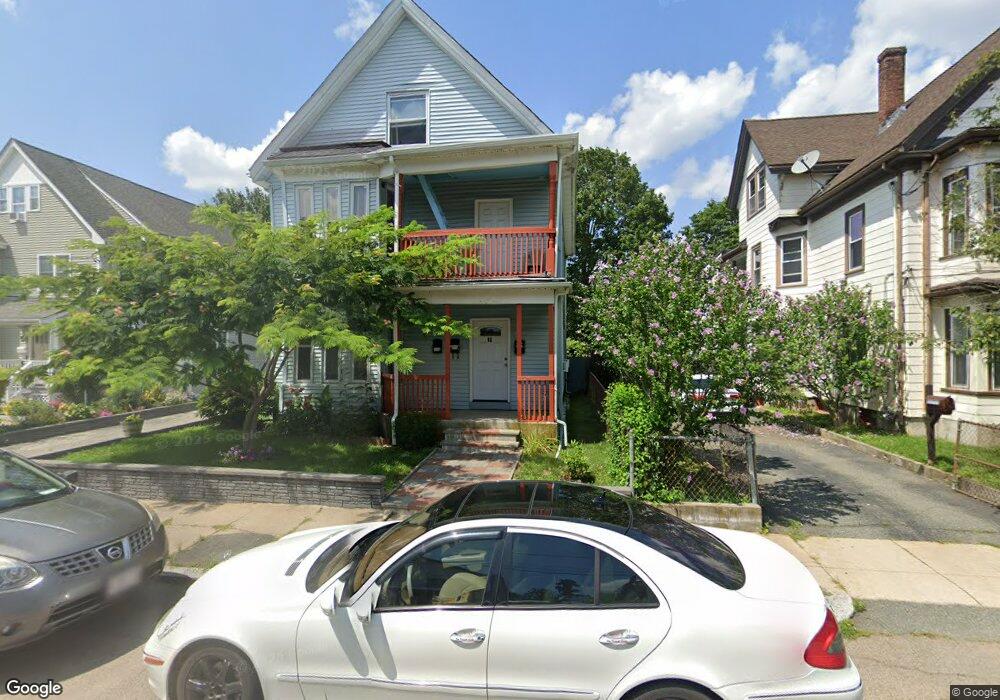
16 Temple St Brockton, MA 02301
Clifton Heights NeighborhoodEstimated Value: $745,000 - $788,000
5
Beds
--
Bath
2,661
Sq Ft
$289/Sq Ft
Est. Value
About This Home
This home is located at 16 Temple St, Brockton, MA 02301 and is currently estimated at $769,000, approximately $288 per square foot. 16 Temple St is a home located in Plymouth County with nearby schools including Gilmore Elementary School, Davis K-8 School, and John F. Kennedy Elementary School.
Ownership History
Date
Name
Owned For
Owner Type
Purchase Details
Closed on
May 25, 2006
Sold by
Deandrade Eugenio F and Andrade Ines P
Bought by
Deandrade Eugenio F and Deandrade Ines P
Current Estimated Value
Home Financials for this Owner
Home Financials are based on the most recent Mortgage that was taken out on this home.
Original Mortgage
$217,500
Interest Rate
6.53%
Mortgage Type
Purchase Money Mortgage
Create a Home Valuation Report for This Property
The Home Valuation Report is an in-depth analysis detailing your home's value as well as a comparison with similar homes in the area
Home Values in the Area
Average Home Value in this Area
Purchase History
| Date | Buyer | Sale Price | Title Company |
|---|---|---|---|
| Deandrade Eugenio F | -- | -- |
Source: Public Records
Mortgage History
| Date | Status | Borrower | Loan Amount |
|---|---|---|---|
| Open | Deandrade Eugenio F | $247,000 | |
| Closed | Deandrade Eugenio F | $217,500 | |
| Previous Owner | Deandrade Eugenio F | $160,000 | |
| Previous Owner | Deandrade Eugenio F | $105,000 |
Source: Public Records
Tax History
| Year | Tax Paid | Tax Assessment Tax Assessment Total Assessment is a certain percentage of the fair market value that is determined by local assessors to be the total taxable value of land and additions on the property. | Land | Improvement |
|---|---|---|---|---|
| 2025 | $7,494 | $618,800 | $138,200 | $480,600 |
| 2024 | $7,478 | $622,100 | $138,200 | $483,900 |
| 2023 | $7,377 | $568,300 | $103,000 | $465,300 |
| 2022 | $7,379 | $528,200 | $93,500 | $434,700 |
| 2021 | $6,664 | $459,600 | $77,500 | $382,100 |
| 2020 | $5,815 | $383,800 | $72,800 | $311,000 |
| 2019 | $5,324 | $342,600 | $70,800 | $271,800 |
| 2018 | $4,794 | $298,500 | $70,800 | $227,700 |
| 2017 | $4,498 | $279,400 | $70,800 | $208,600 |
| 2016 | $4,055 | $233,600 | $68,500 | $165,100 |
| 2015 | $3,468 | $191,100 | $68,500 | $122,600 |
| 2014 | $3,385 | $186,700 | $68,500 | $118,200 |
Source: Public Records
Map
Nearby Homes
Your Personal Tour Guide
Ask me questions while you tour the home.