
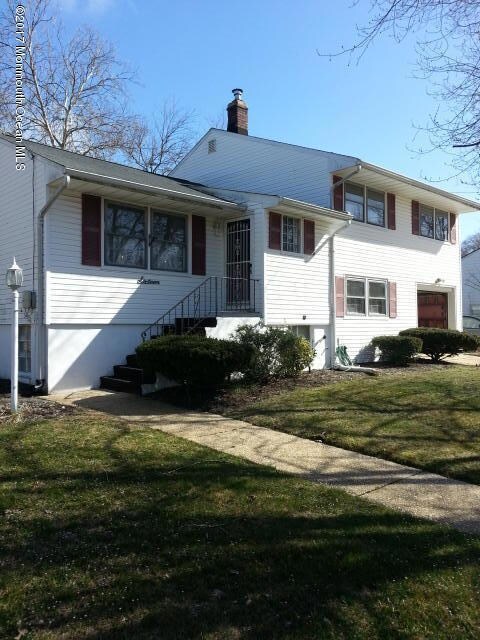
16 Valley Dr Neptune, NJ 07753
Highlights
- Deck
- Attic
- 1 Car Direct Access Garage
- Wood Flooring
- No HOA
- Eat-In Kitchen
About This Home
As of February 2019Spacious Split Level with updated eat-in-kitchen Lower level has family room, bedroom and bath, perfect for an adult child or parent.
Last Agent to Sell the Property
Bonniejean Jensen
Jersey Shore Real Estate Group Associates LLC License #8331530
Home Details
Home Type
- Single Family
Est. Annual Taxes
- $7,329
Year Built
- 1956
Parking
- 1 Car Direct Access Garage
- Driveway
Home Design
- Split Level Home
- Shingle Roof
- Vinyl Siding
Interior Spaces
- Family Room
- Living Room
- Dining Room
- Basement Fills Entire Space Under The House
- Attic
Kitchen
- Eat-In Kitchen
- Stove
Flooring
- Wood
- Wall to Wall Carpet
- Linoleum
Bedrooms and Bathrooms
- 4 Bedrooms
- Primary bedroom located on third floor
- 2 Full Bathrooms
Laundry
- Dryer
- Washer
Outdoor Features
- Deck
Schools
- Neptune Middle School
- Neptune Twp High School
Utilities
- Heating System Uses Oil Above Ground
- Electric Water Heater
Community Details
- No Home Owners Association
- 13-Story Property
Listing and Financial Details
- Assessor Parcel Number 1
Ownership History
Purchase Details
Home Financials for this Owner
Home Financials are based on the most recent Mortgage that was taken out on this home.Purchase Details
Home Financials for this Owner
Home Financials are based on the most recent Mortgage that was taken out on this home.Map
Home Values in the Area
Average Home Value in this Area
Purchase History
| Date | Type | Sale Price | Title Company |
|---|---|---|---|
| Deed | $295,000 | Red Bank Title Agency | |
| Deed | $278,000 | National Title |
Mortgage History
| Date | Status | Loan Amount | Loan Type |
|---|---|---|---|
| Open | $291,379 | FHA | |
| Closed | $289,656 | FHA | |
| Previous Owner | $272,964 | FHA |
Property History
| Date | Event | Price | Change | Sq Ft Price |
|---|---|---|---|---|
| 02/11/2019 02/11/19 | Sold | $295,000 | +6.1% | $190 / Sq Ft |
| 09/22/2017 09/22/17 | Sold | $278,000 | -- | $179 / Sq Ft |
Tax History
| Year | Tax Paid | Tax Assessment Tax Assessment Total Assessment is a certain percentage of the fair market value that is determined by local assessors to be the total taxable value of land and additions on the property. | Land | Improvement |
|---|---|---|---|---|
| 2024 | $7,329 | $483,900 | $243,500 | $240,400 |
| 2023 | $7,329 | $405,800 | $171,000 | $234,800 |
| 2022 | $6,571 | $367,000 | $164,400 | $202,600 |
| 2021 | $5,920 | $311,000 | $155,200 | $155,800 |
| 2020 | $6,057 | $286,000 | $125,100 | $160,900 |
| 2019 | $5,920 | $276,000 | $125,100 | $150,900 |
| 2018 | $5,076 | $233,900 | $115,000 | $118,900 |
| 2017 | $5,085 | $225,100 | $115,000 | $110,100 |
| 2016 | $5,110 | $225,600 | $115,000 | $110,600 |
| 2015 | $4,853 | $217,900 | $110,000 | $107,900 |
| 2014 | $6,055 | $223,500 | $100,000 | $123,500 |
Source: MOREMLS (Monmouth Ocean Regional REALTORS®)
MLS Number: 21710702
APN: 35-03404-0000-00009
Disclaimer: Certain information contained herein is derived from information provided by parties other than Homes.com. All information provided is deemed reliable, but is not guaranteed to be accurate and should be independently verified.
![]() IDX information is provided exclusively for personal, non-commercial use, and may not be used for any purpose other than to identify prospective properties consumers may be interested in purchasing.
IDX information is provided exclusively for personal, non-commercial use, and may not be used for any purpose other than to identify prospective properties consumers may be interested in purchasing.
Information is deemed reliable but not guaranteed.