
Seller's Agent in 2025
Anne Jalbert
Maxfield Real Estate/Center Harbor
(401) 578-3995
2 in this area
22 Total Sales
Estimated Value: $2,043,240 - $2,653,000
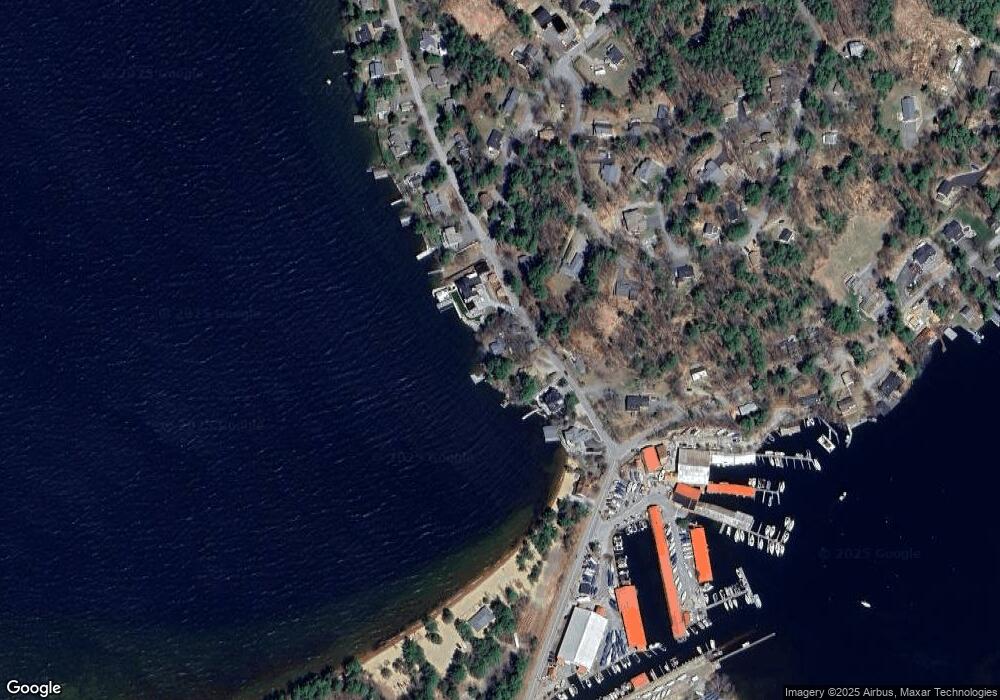
Open the door to Lake Winnipesaukee waterfront living possibilities with this inviting Varney Point property in Gilford, NH. Framed by stunning sunset views over Saunders Bay and set on 135 feet of private shoreline, this year-round home offers the rare combination of move-in comfort and true renovation potential. The sandy swim area, reached by gentle steps, and the concrete pier with 2 deep water slips creates a variety of ways to access the lake. On a footprint just over 20 feet from the waterfront both levels of the home have excellent views of the water and sunset. This offers an inspiring backdrop whether you're dreaming of a simple refresh or a full transformation into your ideal lakeside retreat.
A detached two-car garage has carriage-house potential with views of the lake from both levels offering even more room for guests or future customization. With town sewer and a 450-foot drilled well, the property provides essential infrastructure for renovation flexibility.
The home has been cared for by the same family since 1974 and is ready for its next chapter, whether you lean into its classic lake camp charm or transform it to meet your vision. All of this sits just 20 minutes from I-93 and minutes from Lake Region favorites, including the Bank of NH Pavilion. Varney Point property owners may also join the association for a nominal fee, gaining access to community right-of-ways and social activities. OPEN HOUSE Sat 11/29 12-2 PM
| Date | Event | Price | List to Sale | Price per Sq Ft |
|---|---|---|---|---|
| 11/17/2025 11/17/25 | Price Changed | $2,395,000 | -7.0% | $1,132 / Sq Ft |
| 10/12/2025 10/12/25 | Price Changed | $2,575,000 | -0.9% | $1,217 / Sq Ft |
| 08/22/2025 08/22/25 | Price Changed | $2,599,000 | -2.8% | $1,228 / Sq Ft |
| 06/09/2025 06/09/25 | Price Changed | $2,675,000 | -2.7% | $1,264 / Sq Ft |
| 03/15/2025 03/15/25 | For Sale | $2,750,000 | 0.0% | $1,300 / Sq Ft |
| 03/15/2025 03/15/25 | Off Market | $2,750,000 | -- | -- |
| 03/14/2025 03/14/25 | For Sale | $2,750,000 | 0.0% | $1,300 / Sq Ft |
| 03/14/2025 03/14/25 | Off Market | $2,750,000 | -- | -- |
| 03/13/2025 03/13/25 | For Sale | $2,750,000 | 0.0% | $1,300 / Sq Ft |
| 03/13/2025 03/13/25 | Off Market | $2,750,000 | -- | -- |
| 03/12/2025 03/12/25 | For Sale | $2,750,000 | 0.0% | $1,300 / Sq Ft |
| 03/12/2025 03/12/25 | Off Market | $2,750,000 | -- | -- |
| 03/11/2025 03/11/25 | For Sale | $2,750,000 | 0.0% | $1,300 / Sq Ft |
| 03/11/2025 03/11/25 | Off Market | $2,750,000 | -- | -- |
| 03/10/2025 03/10/25 | For Sale | $2,750,000 | 0.0% | $1,300 / Sq Ft |
| 03/10/2025 03/10/25 | Off Market | $2,750,000 | -- | -- |
| 03/08/2025 03/08/25 | For Sale | $2,750,000 | 0.0% | $1,300 / Sq Ft |
| 03/08/2025 03/08/25 | Off Market | $2,750,000 | -- | -- |
| 03/07/2025 03/07/25 | For Sale | $2,750,000 | 0.0% | $1,300 / Sq Ft |
| 03/07/2025 03/07/25 | Off Market | $2,750,000 | -- | -- |
| 03/06/2025 03/06/25 | For Sale | $2,750,000 | 0.0% | $1,300 / Sq Ft |
| 03/06/2025 03/06/25 | Off Market | $2,750,000 | -- | -- |
| 03/02/2025 03/02/25 | For Sale | $2,750,000 | -- | $1,300 / Sq Ft |
| Year | Tax Paid | Tax Assessment Tax Assessment Total Assessment is a certain percentage of the fair market value that is determined by local assessors to be the total taxable value of land and additions on the property. | Land | Improvement |
|---|---|---|---|---|
| 2024 | $14,269 | $1,268,360 | $872,060 | $396,300 |
| 2023 | $13,064 | $1,268,360 | $872,060 | $396,300 |
| 2022 | $13,578 | $1,108,390 | $792,590 | $315,800 |
| 2021 | $13,611 | $1,108,390 | $792,590 | $315,800 |
| 2020 | $15,609 | $1,038,490 | $792,590 | $245,900 |
| 2019 | $18,498 | $1,166,340 | $929,440 | $236,900 |
| 2018 | $13,732 | $805,880 | $610,280 | $195,600 |
| 2017 | $13,963 | $808,980 | $610,280 | $198,700 |
| 2016 | $13,117 | $730,750 | $554,150 | $176,600 |
| 2015 | $13,060 | $726,750 | $554,150 | $172,600 |
| 2011 | $14,481 | $780,670 | $635,170 | $145,500 |
Seller's Agent in 2025
Anne Jalbert
Maxfield Real Estate/Center Harbor
(401) 578-3995
2 in this area
22 Total Sales