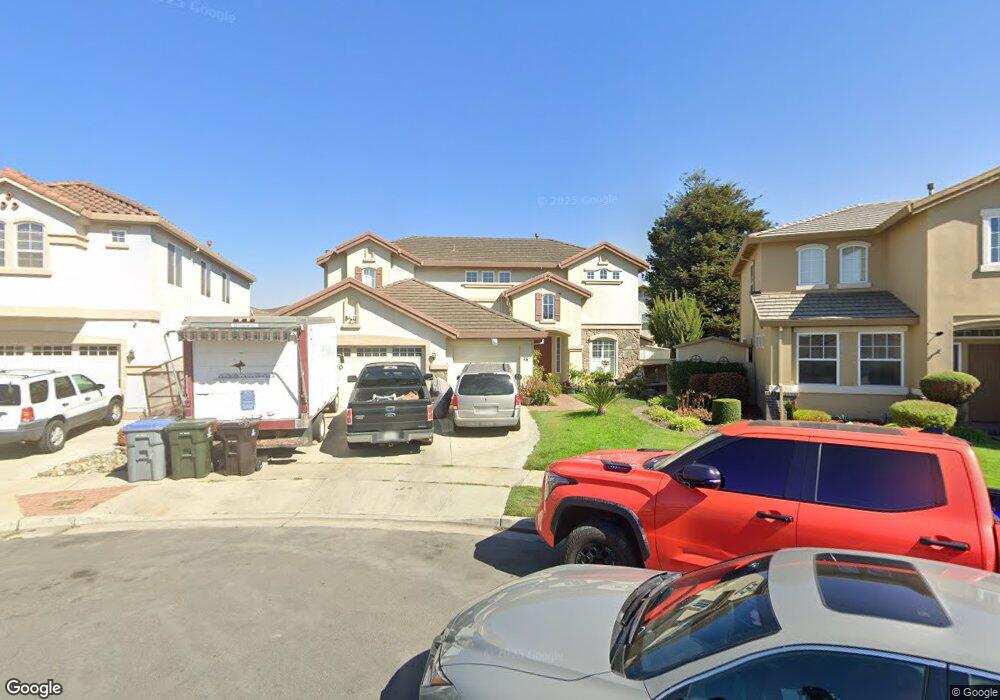
16 Victoria Cir Salinas, CA 93906
Harden Ranch NeighborhoodEstimated Value: $898,681 - $1,002,000
3
Beds
3
Baths
2,473
Sq Ft
$388/Sq Ft
Est. Value
About This Home
This home is located at 16 Victoria Cir, Salinas, CA 93906 and is currently estimated at $959,170, approximately $387 per square foot. 16 Victoria Cir is a home located in Monterey County with nearby schools including North Salinas High School.
Ownership History
Date
Name
Owned For
Owner Type
Purchase Details
Closed on
Jul 21, 2010
Sold by
Hanamaikai Leslie and Olivares Claire
Bought by
Aurora Loan Services Llc
Current Estimated Value
Purchase Details
Closed on
Jun 17, 2005
Sold by
Macias Ruben and Armendariz Jaqueline
Bought by
Hanamaikai Leslie and Olivares Claire
Home Financials for this Owner
Home Financials are based on the most recent Mortgage that was taken out on this home.
Original Mortgage
$599,000
Interest Rate
1%
Mortgage Type
Fannie Mae Freddie Mac
Purchase Details
Closed on
Jul 23, 2002
Sold by
Macias Ruben
Bought by
Macias Ruben and Armendariz Jaqueline
Home Financials for this Owner
Home Financials are based on the most recent Mortgage that was taken out on this home.
Original Mortgage
$259,500
Interest Rate
6.7%
Purchase Details
Closed on
Jan 3, 2000
Sold by
Harrod Brothers
Bought by
Macias Ruben
Home Financials for this Owner
Home Financials are based on the most recent Mortgage that was taken out on this home.
Original Mortgage
$252,700
Interest Rate
7.62%
Create a Home Valuation Report for This Property
The Home Valuation Report is an in-depth analysis detailing your home's value as well as a comparison with similar homes in the area
Home Values in the Area
Average Home Value in this Area
Purchase History
| Date | Buyer | Sale Price | Title Company |
|---|---|---|---|
| Aurora Loan Services Llc | $365,000 | Accommodation | |
| Hanamaikai Leslie | $829,000 | Fidelity Title | |
| Macias Ruben | -- | First American Title | |
| Macias Ruben | $318,500 | Chicago Title Co |
Source: Public Records
Mortgage History
| Date | Status | Borrower | Loan Amount |
|---|---|---|---|
| Previous Owner | Hanamaikai Leslie | $599,000 | |
| Previous Owner | Macias Ruben | $259,500 | |
| Previous Owner | Macias Ruben | $252,700 |
Source: Public Records
Tax History
| Year | Tax Paid | Tax Assessment Tax Assessment Total Assessment is a certain percentage of the fair market value that is determined by local assessors to be the total taxable value of land and additions on the property. | Land | Improvement |
|---|---|---|---|---|
| 2025 | $5,278 | $441,991 | $102,487 | $339,504 |
| 2024 | $5,278 | $433,326 | $100,478 | $332,848 |
| 2023 | $4,869 | $424,830 | $98,508 | $326,322 |
| 2022 | $4,822 | $416,501 | $96,577 | $319,924 |
| 2021 | $4,741 | $408,335 | $94,684 | $313,651 |
| 2020 | $4,533 | $404,149 | $93,714 | $310,435 |
| 2019 | $4,400 | $396,226 | $91,877 | $304,349 |
| 2018 | $4,531 | $388,458 | $90,076 | $298,382 |
| 2017 | $4,578 | $380,842 | $88,310 | $292,532 |
| 2016 | $4,443 | $373,376 | $86,579 | $286,797 |
| 2015 | $4,406 | $367,769 | $85,279 | $282,490 |
| 2014 | $4,222 | $360,566 | $83,609 | $276,957 |
Source: Public Records
Map
Nearby Homes
- 1838 Lancashire Dr
- 327 Rhine Ct
- 1667 Klamath Dr
- 607 Calaveras Dr
- 233 Montclair Ln
- 1780 Truckee Way
- 1823 Broadway Dr
- 634 Yreka Dr
- 1829 Delancey Dr
- 383 Natividad Rd
- 1445 Amador Cir
- 1527 Atherton Way
- 1421 Amador Cir
- 336 Rainier Dr
- 323 Chaparral St
- 1671 Cambrian Dr
- 18594 Northridge Dr
- 55 San Juan Grade Rd Unit 79
- 55 San Juan Grade Rd Unit 18
- 55 San Juan Grade Rd Unit 63
- 20 Victoria Cir
- 12 Victoria Cir
- 1813 Cromwell Dr
- 1817 Cromwell Dr
- 1809 Cromwell Dr
- 23 Victoria Cir
- 424 Chardonnay Dr
- 8 Victoria Cir
- 420 Chardonnay Dr
- 1805 Cromwell Dr
- 428 Chardonnay Dr
- 416 Chardonnay Dr
- 19 Victoria Cir
- 15 Victoria Cir
- 412 Chardonnay Dr
- 11 Victoria Cir
- 427 Victoria Ave
- 423 Victoria Ave
- 431 Victoria Ave
- 408 Chardonnay Dr
Your Personal Tour Guide
Ask me questions while you tour the home.