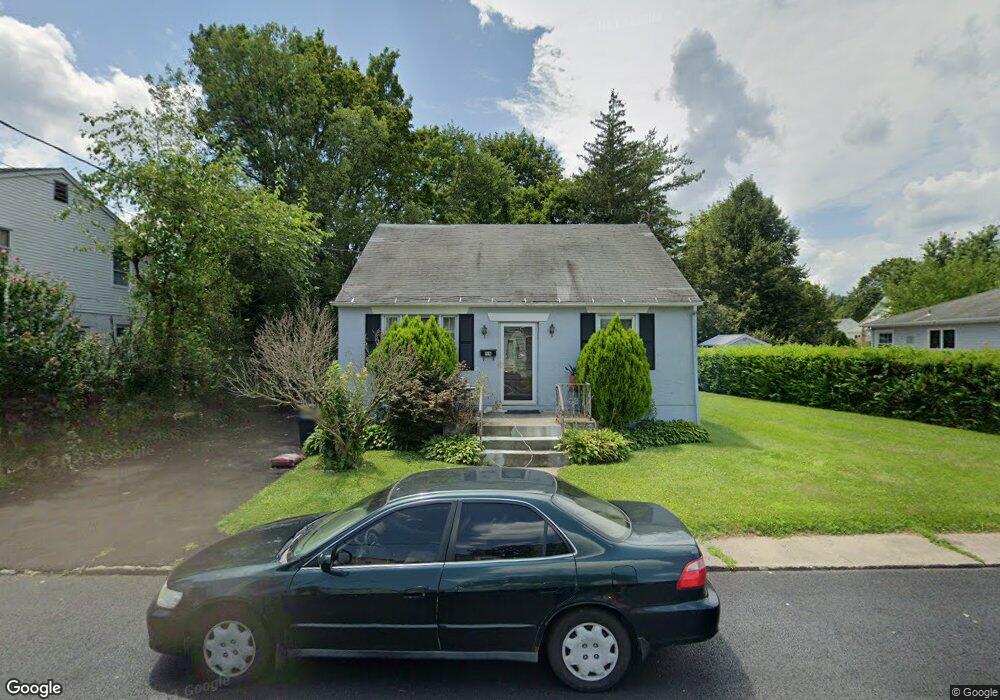
16 Whaley St Danbury, CT 06810
Estimated Value: $366,680 - $427,000
4
Beds
1
Bath
1,177
Sq Ft
$340/Sq Ft
Est. Value
About This Home
This home is located at 16 Whaley St, Danbury, CT 06810 and is currently estimated at $400,420, approximately $340 per square foot. 16 Whaley St is a home located in Fairfield County with nearby schools including Morris Street Elementary School, Rogers Park Middle School, and Danbury High School.
Ownership History
Date
Name
Owned For
Owner Type
Purchase Details
Closed on
Jul 18, 2003
Sold by
Vegerano Luis
Bought by
Silva Geraldo and Viganor Sandea
Current Estimated Value
Home Financials for this Owner
Home Financials are based on the most recent Mortgage that was taken out on this home.
Original Mortgage
$221,270
Outstanding Balance
$94,640
Interest Rate
5.34%
Estimated Equity
$305,780
Purchase Details
Closed on
Mar 10, 1998
Sold by
Demasi Cosimo and Demasi Maria
Bought by
Vegerano Luis
Purchase Details
Closed on
Dec 1, 1988
Sold by
Sassso Marcella
Bought by
Demosi Cosimo
Purchase Details
Closed on
Feb 11, 1987
Sold by
Bonner Chas
Bought by
Sasso Marcella
Create a Home Valuation Report for This Property
The Home Valuation Report is an in-depth analysis detailing your home's value as well as a comparison with similar homes in the area
Home Values in the Area
Average Home Value in this Area
Purchase History
| Date | Buyer | Sale Price | Title Company |
|---|---|---|---|
| Silva Geraldo | $235,000 | -- | |
| Vegerano Luis | $120,000 | -- | |
| Demosi Cosimo | $157,000 | -- | |
| Sasso Marcella | $138,000 | -- |
Source: Public Records
Mortgage History
| Date | Status | Borrower | Loan Amount |
|---|---|---|---|
| Open | Sasso Marcella | $221,270 | |
| Previous Owner | Sasso Marcella | $136,000 | |
| Previous Owner | Sasso Marcella | $140,400 |
Source: Public Records
Tax History Compared to Growth
Tax History
| Year | Tax Paid | Tax Assessment Tax Assessment Total Assessment is a certain percentage of the fair market value that is determined by local assessors to be the total taxable value of land and additions on the property. | Land | Improvement |
|---|---|---|---|---|
| 2025 | $4,699 | $188,020 | $61,320 | $126,700 |
| 2024 | $4,595 | $188,020 | $61,320 | $126,700 |
| 2023 | $4,387 | $188,020 | $61,320 | $126,700 |
| 2022 | $3,643 | $129,100 | $63,800 | $65,300 |
| 2021 | $3,563 | $129,100 | $63,800 | $65,300 |
| 2020 | $3,563 | $129,100 | $63,800 | $65,300 |
| 2019 | $3,563 | $129,100 | $63,800 | $65,300 |
| 2018 | $3,563 | $129,100 | $63,800 | $65,300 |
| 2017 | $3,500 | $120,900 | $60,800 | $60,100 |
| 2016 | $3,467 | $120,900 | $60,800 | $60,100 |
| 2015 | $3,417 | $120,900 | $60,800 | $60,100 |
| 2014 | $3,337 | $120,900 | $60,800 | $60,100 |
Source: Public Records
Map
Nearby Homes