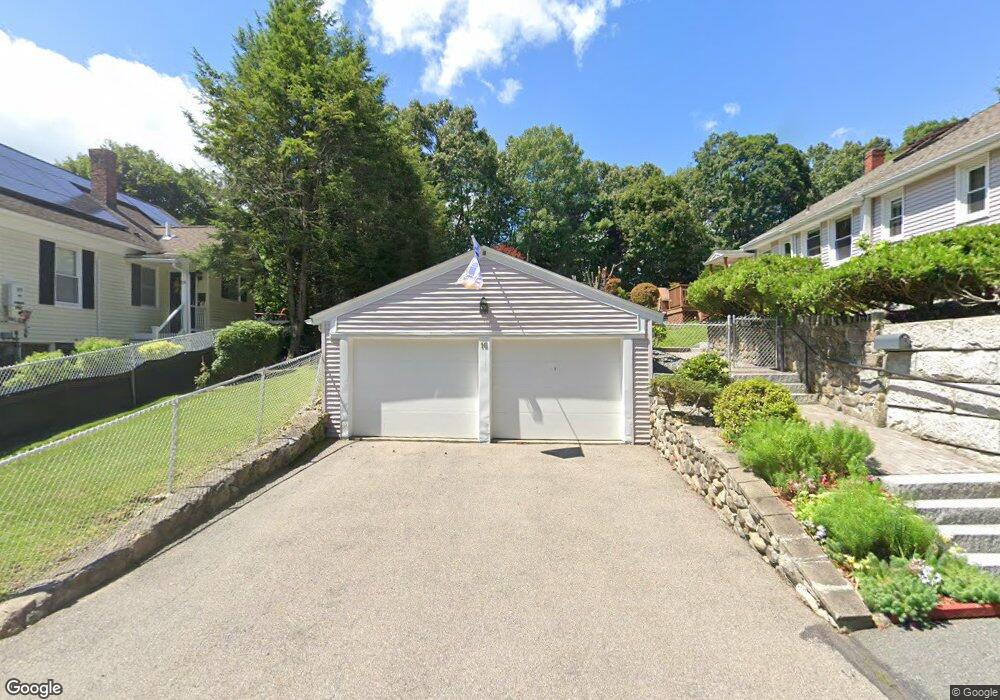
16 Windsor St Methuen, MA 01844
Downtown Methuen NeighborhoodEstimated Value: $583,000 - $650,000
3
Beds
2
Baths
1,896
Sq Ft
$319/Sq Ft
Est. Value
About This Home
This home is located at 16 Windsor St, Methuen, MA 01844 and is currently estimated at $605,603, approximately $319 per square foot. 16 Windsor St is a home located in Essex County with nearby schools including Tenney Grammar School, Methuen High School, and Lawrence Family Development Charter School.
Ownership History
Date
Name
Owned For
Owner Type
Purchase Details
Closed on
Jun 30, 1995
Sold by
Goodhue Stephen H
Bought by
Phillips Steven P
Current Estimated Value
Home Financials for this Owner
Home Financials are based on the most recent Mortgage that was taken out on this home.
Original Mortgage
$108,700
Interest Rate
7.8%
Mortgage Type
Purchase Money Mortgage
Create a Home Valuation Report for This Property
The Home Valuation Report is an in-depth analysis detailing your home's value as well as a comparison with similar homes in the area
Home Values in the Area
Average Home Value in this Area
Purchase History
| Date | Buyer | Sale Price | Title Company |
|---|---|---|---|
| Phillips Steven P | $135,900 | -- | |
| Phillips Steven P | $135,900 | -- |
Source: Public Records
Mortgage History
| Date | Status | Borrower | Loan Amount |
|---|---|---|---|
| Open | Phillips Steven P | $145,000 | |
| Closed | Phillips Steven P | $108,700 |
Source: Public Records
Tax History
| Year | Tax Paid | Tax Assessment Tax Assessment Total Assessment is a certain percentage of the fair market value that is determined by local assessors to be the total taxable value of land and additions on the property. | Land | Improvement |
|---|---|---|---|---|
| 2025 | $5,286 | $499,600 | $226,400 | $273,200 |
| 2024 | $5,219 | $480,600 | $206,600 | $274,000 |
| 2023 | $5,009 | $428,100 | $183,600 | $244,500 |
| 2022 | $4,633 | $355,000 | $145,400 | $209,600 |
| 2021 | $4,407 | $334,100 | $137,700 | $196,400 |
| 2020 | $4,312 | $320,800 | $137,700 | $183,100 |
| 2019 | $4,051 | $285,500 | $130,100 | $155,400 |
| 2018 | $3,833 | $268,600 | $122,400 | $146,200 |
| 2017 | $3,761 | $256,700 | $122,400 | $134,300 |
| 2016 | $3,497 | $236,100 | $107,100 | $129,000 |
| 2015 | $3,447 | $236,100 | $107,100 | $129,000 |
Source: Public Records
Map
Nearby Homes
- 37 Maplewood Ave
- 20 Ruskin Ave
- 65 Clayton Ave
- 20-22 Ashland Ave
- 7-9 Carleton Ct
- 2 Grove St
- 24 Railroad St
- 23 Chase St
- 76 Haverhill St
- 9-11 Horne St
- 88-90 Columbus Ave
- 14-16 Cypress Ave
- 42 Perley St
- 42-44 Cypress Ave
- 13 Caswell Ave
- 29 Center St
- 179-181 West St
- 36 Manchester St
- 50 Forest St
- 2 Landmark Dr
Your Personal Tour Guide
Ask me questions while you tour the home.