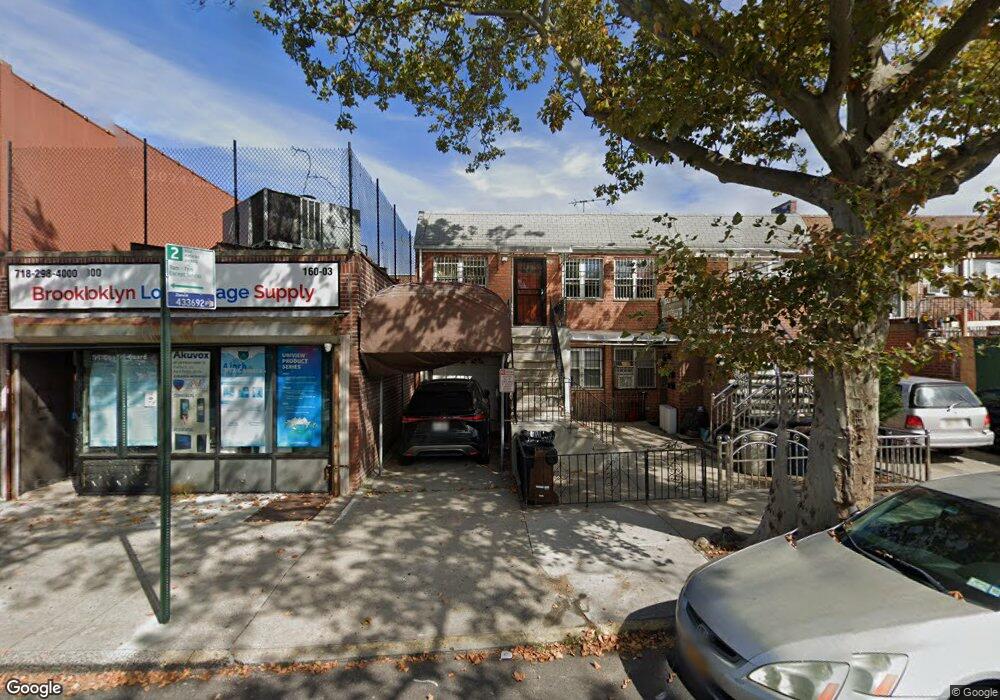
160-05 Horace Harding Expy Flushing, NY 11365
Flushing NeighborhoodEstimated Value: $1,075,718
7
Beds
3
Baths
1,540
Sq Ft
$699/Sq Ft
Est. Value
About This Home
This home is located at 160-05 Horace Harding Expy, Flushing, NY 11365 and is currently estimated at $1,075,718, approximately $698 per square foot. 160-05 Horace Harding Expy is a home located in Queens County with nearby schools including P.S. 163 - Flushing Heights, Rachel Carson I.S. 237Q, and Francis Lewis High School.
Ownership History
Date
Name
Owned For
Owner Type
Purchase Details
Closed on
Oct 27, 2023
Sold by
Lin Guo Ming and Zheng Chunhua
Bought by
Lin Guoming and Lin Qiu Xian
Current Estimated Value
Home Financials for this Owner
Home Financials are based on the most recent Mortgage that was taken out on this home.
Original Mortgage
$5,747
Outstanding Balance
$5,641
Interest Rate
7.19%
Mortgage Type
Purchase Money Mortgage
Estimated Equity
$1,070,077
Purchase Details
Closed on
May 1, 2018
Sold by
Iannece Jerry M and Iannece Lynn Calvacca
Bought by
Lin Guo Ming and Zheng Chunhua
Home Financials for this Owner
Home Financials are based on the most recent Mortgage that was taken out on this home.
Original Mortgage
$450,000
Outstanding Balance
$387,822
Interest Rate
4.44%
Mortgage Type
New Conventional
Estimated Equity
$687,896
Create a Home Valuation Report for This Property
The Home Valuation Report is an in-depth analysis detailing your home's value as well as a comparison with similar homes in the area
Home Values in the Area
Average Home Value in this Area
Purchase History
| Date | Buyer | Sale Price | Title Company |
|---|---|---|---|
| Lin Guoming | $450,000 | -- | |
| Lin Guoming | -- | -- | |
| Lin Guoming | $450,000 | -- | |
| Lin Guoming | -- | -- | |
| Lin Guo Ming | $900,000 | -- | |
| Lin Guo Ming | $900,000 | -- |
Source: Public Records
Mortgage History
| Date | Status | Borrower | Loan Amount |
|---|---|---|---|
| Open | Lin Guoming | $5,747 | |
| Closed | Lin Guoming | $5,747 | |
| Open | Lin Guo Ming | $450,000 | |
| Closed | Lin Guo Ming | $450,000 |
Source: Public Records
Tax History Compared to Growth
Tax History
| Year | Tax Paid | Tax Assessment Tax Assessment Total Assessment is a certain percentage of the fair market value that is determined by local assessors to be the total taxable value of land and additions on the property. | Land | Improvement |
|---|---|---|---|---|
| 2025 | $8,903 | $46,985 | $12,265 | $34,720 |
| 2024 | $8,903 | $44,326 | $11,222 | $33,104 |
| 2023 | $8,399 | $41,818 | $11,061 | $30,757 |
| 2022 | $8,279 | $48,300 | $15,600 | $32,700 |
| 2021 | $8,582 | $44,700 | $15,600 | $29,100 |
| 2020 | $8,288 | $52,320 | $15,600 | $36,720 |
| 2019 | $7,727 | $55,080 | $15,600 | $39,480 |
| 2018 | $7,104 | $34,848 | $9,180 | $25,668 |
| 2017 | $7,045 | $34,560 | $9,704 | $24,856 |
| 2016 | $6,794 | $34,560 | $9,704 | $24,856 |
| 2015 | $3,932 | $32,628 | $13,193 | $19,435 |
| 2014 | $3,932 | $30,782 | $14,115 | $16,667 |
Source: Public Records
Map
Nearby Homes
- 61-27 160 St
- 5944 159th St
- 159-08 59th Ave
- 6126 164th St
- 16216 65th Ave
- 160-12 Booth Memorial Ave
- 6133 157th St
- 57-19 Parsons Blvd
- 5728 Parsons Blvd Unit Front
- 59-39 156th St
- 57-12 164th St
- 156-14 65th Ave
- 155-17 65th Ave
- 154-39 64th Ave
- 64-12 155th St
- 65-26 167th St
- 16615 67th Ave
- 153-40 58th Ave
- 153-51 Horace Harding Expy
- 6009 170th St
- 16007 Horace Harding Expy Unit 1 Fl
- 16007 Horace Harding Expy Unit 2 Fl
- 16007 Horace Harding Expy
- 16007 Horace Harding Expy
- 16005 Horace Harding Expy
- 16005 Horace Harding Expy
- 16009 Horace Harding Expy
- 16015 Horace Harding Expy
- 5949 160th St
- 59-49 160th St Unit 3FL
- 16011 Horace Harding Expy
- 16001 Horace Harding Expy
- 1603 Horace Harding Expy
- 16003 Horace Harding Expy
- 59-47 160th St Unit 3FL
- 5947 160th St
- 5945 160th St
- 160-17 Horace Harding Expy
- 16017 Horace Harding Expy
- 5948 161st St