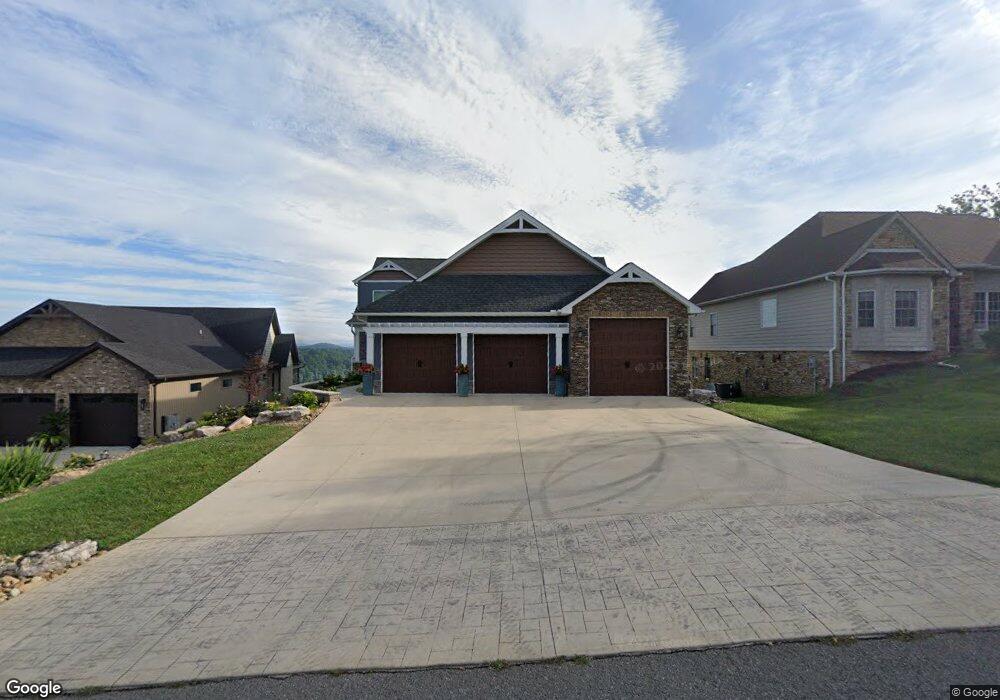
160 Anchor Ln Andersonville, TN 37705
Estimated Value: $762,000 - $913,000
--
Bed
--
Bath
2,501
Sq Ft
$333/Sq Ft
Est. Value
About This Home
This home is located at 160 Anchor Ln, Andersonville, TN 37705 and is currently estimated at $831,866, approximately $332 per square foot. 160 Anchor Ln is a home with nearby schools including Norris Middle School.
Ownership History
Date
Name
Owned For
Owner Type
Purchase Details
Closed on
Oct 18, 2017
Sold by
Watson Hubert A and Watson Susan M
Bought by
Lathrop James Robert and Lathrop Lorene Ann
Current Estimated Value
Purchase Details
Closed on
Sep 8, 2017
Sold by
Tennessee Investment Properties Llc
Bought by
Watson Hubert A and Watson Wife Susan M Watson
Purchase Details
Closed on
Sep 1, 2017
Sold by
Watson Hubert A
Bought by
Tennessee Investment Properties Llc
Purchase Details
Closed on
Jul 8, 2011
Sold by
Young Roger
Bought by
Watson Hubert A and Watson Susan M
Home Financials for this Owner
Home Financials are based on the most recent Mortgage that was taken out on this home.
Original Mortgage
$80,000
Interest Rate
4.52%
Mortgage Type
Commercial
Purchase Details
Closed on
Sep 10, 2004
Bought by
Young Roger and Young Wife Diane
Purchase Details
Closed on
Feb 28, 2002
Purchase Details
Closed on
Jul 7, 2000
Bought by
Stardust Properties Llc No 4 Jacksboro Place
Create a Home Valuation Report for This Property
The Home Valuation Report is an in-depth analysis detailing your home's value as well as a comparison with similar homes in the area
Home Values in the Area
Average Home Value in this Area
Purchase History
| Date | Buyer | Sale Price | Title Company |
|---|---|---|---|
| Lathrop James Robert | $50,000 | None Available | |
| Watson Hubert A | -- | -- | |
| Watson Hubert A | -- | Knoxville Title Agency | |
| Tennessee Investment Properties Llc | -- | -- | |
| Watson Hubert A | $100,000 | -- | |
| Young Roger | $90,000 | -- | |
| -- | $74,500 | -- | |
| Stardust Properties Llc No 4 Jacksboro Place | $4,250,000 | -- |
Source: Public Records
Mortgage History
| Date | Status | Borrower | Loan Amount |
|---|---|---|---|
| Previous Owner | Watson Hubert A | $80,000 |
Source: Public Records
Tax History Compared to Growth
Tax History
| Year | Tax Paid | Tax Assessment Tax Assessment Total Assessment is a certain percentage of the fair market value that is determined by local assessors to be the total taxable value of land and additions on the property. | Land | Improvement |
|---|---|---|---|---|
| 2024 | $3,623 | $137,800 | $18,250 | $119,550 |
| 2023 | $3,623 | $137,800 | $0 | $0 |
| 2022 | $3,623 | $137,800 | $18,250 | $119,550 |
| 2021 | $3,623 | $137,800 | $18,250 | $119,550 |
| 2020 | $754 | $137,800 | $18,250 | $119,550 |
| 2019 | $2,330 | $80,600 | $27,025 | $53,575 |
| 2018 | $754 | $27,025 | $27,025 | $0 |
| 2017 | $754 | $27,025 | $27,025 | $0 |
| 2016 | $754 | $27,025 | $27,025 | $0 |
| 2015 | -- | $27,025 | $27,025 | $0 |
| 2014 | -- | $27,025 | $27,025 | $0 |
| 2013 | -- | $27,000 | $0 | $0 |
Source: Public Records
Map
Nearby Homes
- 0 Harbour Club Place Unit 1307207
- 105 Top Sail Ct
- 612 Pinnacle Point
- 0 Ridge Circle Rd Unit 1280025
- 0 Ridge Circle Rd Unit 1280024
- 340 Duncan Ln
- 0 Engle Dr
- 112 Tanasi Ln
- 328 Ridge Circle Rd
- 0 Mcafee Rd
- 2024 Park Ln
- 0 Hagaman Trail Unit 1308257
- 131 Northshore Dr
- 211 Club House Dr
- 360 Sequoyah Rd
- 247 Lakeview Ln
- 565 S Two Rivers Ln
- 111 Stone Ridge Dr
- Lot 559 Summer Cir
- 516 Cedar Gate Ln
- Lot 12r Anchor Ln
- 156 Anchor Ln
- 83 Harbour Club Place
- 152 Anchor Dr
- 0 Anchor Lot 16 Ln Unit 1255705
- 157 Anchor Ln
- 153 Anchor Ln
- 712 Pinnacle Pointe Unit 712
- 742 Pinnacle Pointe Unit 742
- 0 Harbour Club Place Unit 4H 577137
- 0 Harbour Club Place Unit 4E 577134
- 0 Harbour Club Place Unit 4G 577136
- 0 Harbour Club Place Unit 4D 577133
- 0 Harbour Club Place Unit 4F 577135
- 0 Harbour Club Place Unit 4C 577132
- 0 Harbour Club Place Unit 4A 577130
- 0 Harbour Club Place Unit 4B 577131
- 0 Harbour Club Place Unit 3G 577066
- 0 Harbour Club Place Unit 3H 577068
- 0 Harbour Club Place Unit 3E 577062