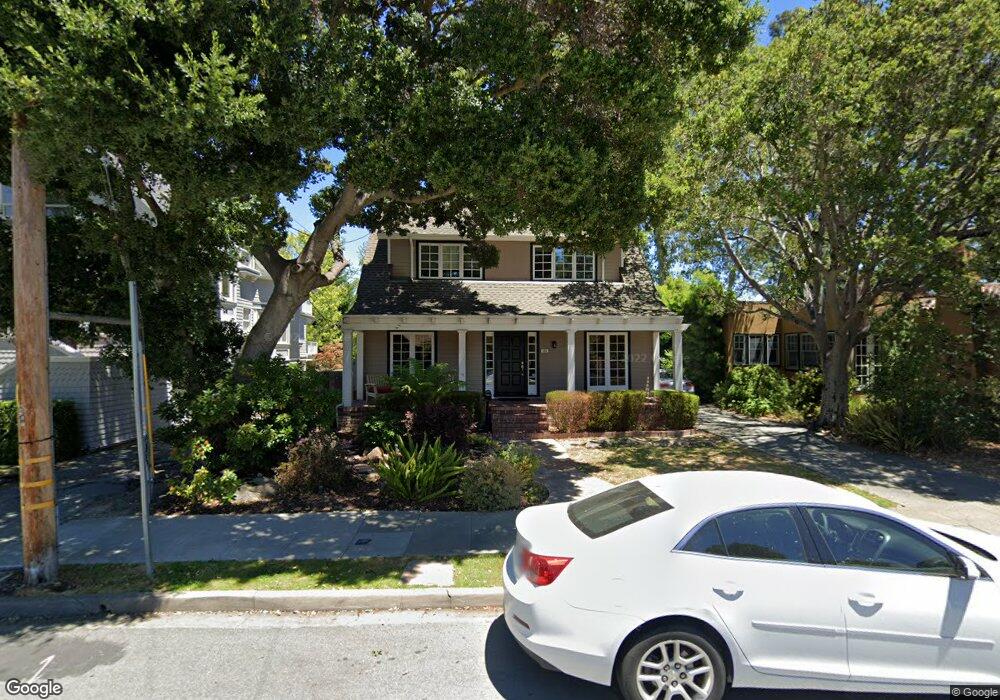
160 Chapin Ln Burlingame, CA 94010
Burlingame Park NeighborhoodEstimated Value: $3,231,000 - $4,316,000
4
Beds
3
Baths
2,650
Sq Ft
$1,455/Sq Ft
Est. Value
About This Home
This home is located at 160 Chapin Ln, Burlingame, CA 94010 and is currently estimated at $3,854,746, approximately $1,454 per square foot. 160 Chapin Ln is a home located in San Mateo County with nearby schools including Washington Elementary School, Burlingame Intermediate School, and Burlingame High School.
Ownership History
Date
Name
Owned For
Owner Type
Purchase Details
Closed on
Nov 13, 2012
Sold by
Beswick Brian K and Beswick Jenifer A
Bought by
Beswick Brian K and Beswick Jenifer A
Current Estimated Value
Home Financials for this Owner
Home Financials are based on the most recent Mortgage that was taken out on this home.
Original Mortgage
$616,000
Outstanding Balance
$424,659
Interest Rate
3.34%
Mortgage Type
New Conventional
Estimated Equity
$3,430,087
Purchase Details
Closed on
Jan 9, 2003
Sold by
Beswick Brian K and Beswick Jenifer A
Bought by
Beswick Brian K and Beswick Jenifer
Home Financials for this Owner
Home Financials are based on the most recent Mortgage that was taken out on this home.
Original Mortgage
$514,000
Interest Rate
6.15%
Purchase Details
Closed on
Nov 7, 2002
Sold by
Beswick Brian K and Beswick Jenifer
Bought by
Beswick Brian K and Beswick Jenifer A
Purchase Details
Closed on
Oct 14, 1999
Sold by
Leist Edward A and Leist Teresa J
Bought by
Beswick Brian K and Beswick Jenifer
Home Financials for this Owner
Home Financials are based on the most recent Mortgage that was taken out on this home.
Original Mortgage
$650,000
Interest Rate
7.25%
Purchase Details
Closed on
Apr 14, 1999
Sold by
Leist Edward A
Bought by
Leist Edward A and Leist Teresa J
Create a Home Valuation Report for This Property
The Home Valuation Report is an in-depth analysis detailing your home's value as well as a comparison with similar homes in the area
Home Values in the Area
Average Home Value in this Area
Purchase History
| Date | Buyer | Sale Price | Title Company |
|---|---|---|---|
| Beswick Brian K | -- | First American Title Company | |
| Beswick Brian K | -- | Fidelity National Title | |
| Beswick Brian K | -- | -- | |
| Beswick Brian K | $840,000 | First American Title Co | |
| Leist Edward A | -- | -- |
Source: Public Records
Mortgage History
| Date | Status | Borrower | Loan Amount |
|---|---|---|---|
| Open | Beswick Brian K | $616,000 | |
| Closed | Beswick Brian K | $514,000 | |
| Closed | Beswick Brian K | $650,000 |
Source: Public Records
Tax History Compared to Growth
Tax History
| Year | Tax Paid | Tax Assessment Tax Assessment Total Assessment is a certain percentage of the fair market value that is determined by local assessors to be the total taxable value of land and additions on the property. | Land | Improvement |
|---|---|---|---|---|
| 2025 | $16,320 | $1,443,410 | $645,525 | $797,885 |
| 2023 | $16,320 | $1,387,363 | $620,459 | $766,904 |
| 2022 | $15,742 | $1,360,162 | $608,294 | $751,868 |
| 2021 | $15,762 | $1,333,493 | $596,367 | $737,126 |
| 2020 | $15,436 | $1,319,820 | $590,252 | $729,568 |
| 2019 | $15,097 | $1,293,943 | $578,679 | $715,264 |
| 2018 | $14,810 | $1,268,573 | $567,333 | $701,240 |
| 2017 | $14,702 | $1,243,700 | $556,209 | $687,491 |
| 2016 | $14,163 | $1,219,314 | $545,303 | $674,011 |
| 2015 | $14,100 | $1,201,001 | $537,113 | $663,888 |
| 2014 | $13,896 | $1,177,476 | $526,592 | $650,884 |
Source: Public Records
Map
Nearby Homes
- 343 Warren Rd
- 215 Warren Rd
- 720 Brewer Dr
- 550 El Camino Real Unit 302
- 670 Edgewood Rd
- 626 Occidental Ave
- 715 Brewer Dr
- 1515 Floribunda Ave Unit 309
- 110 Park Rd Unit 103
- 1433 Floribunda Ave Unit 5
- 1433 Floribunda Ave Unit 7
- 1433 Floribunda Ave Unit 2
- 1433 Floribunda Ave Unit 1
- 1427 Floribunda Ave Unit 304
- 22 Pinecrest Terrace
- 1133 Douglas Ave Unit 3
- 735 El Camino Real Unit 104
- 1121 Douglas Ave Unit 201
- 680 Fairway Cir
- 828 N El Camino Real Unit 9
- 156 Chapin Ln
- 150 Chapin Ln
- 1617 Ralston Ave
- 270 Chapin Ln
- 1615 Ralston Ave
- 146 Chapin Ln
- 157 Occidental Ave
- 149 Occidental Ave
- 1611 Ralston Ave
- 225 Chapin Ln
- 217 Chapin Ln
- 211 Occidental Ave
- 233 Chapin Ln
- 145 Occidental Ave
- 215 Chapin Ln
- 144 Chapin Ln
- 1609 Ralston Ave
- 141 Occidental Ave
- 1601 Ralston Ave
- 148 Pepper Ave