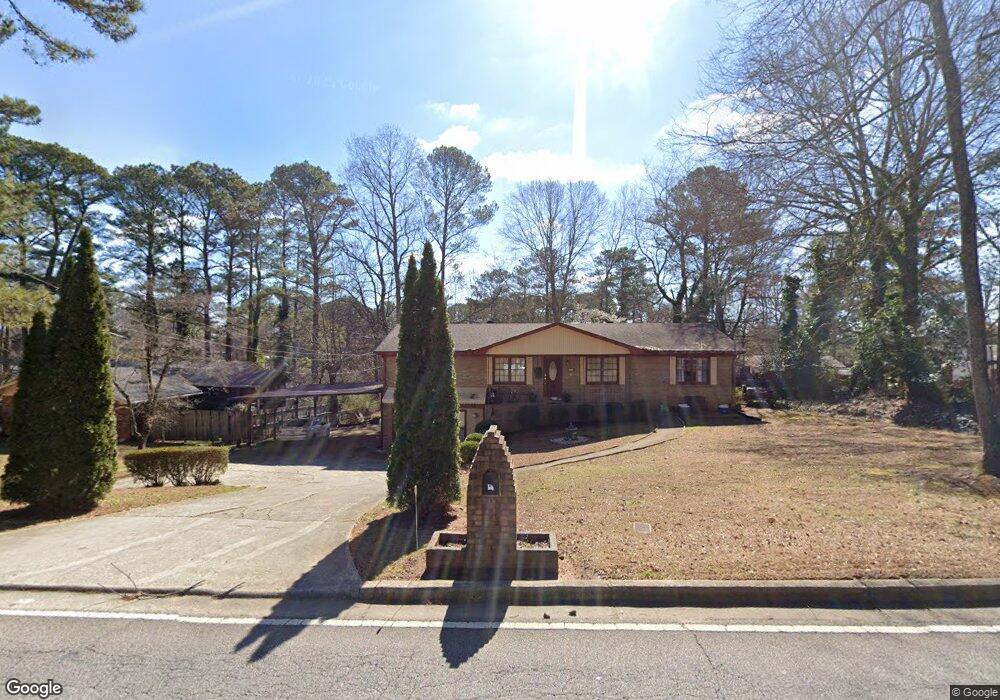
160 Concord Rd SE Smyrna, GA 30082
Estimated Value: $411,000 - $487,000
3
Beds
2
Baths
1,769
Sq Ft
$249/Sq Ft
Est. Value
About This Home
This home is located at 160 Concord Rd SE, Smyrna, GA 30082 and is currently estimated at $439,648, approximately $248 per square foot. 160 Concord Rd SE is a home located in Cobb County with nearby schools including King Springs Elementary School, Griffin Middle School, and Campbell High School.
Ownership History
Date
Name
Owned For
Owner Type
Purchase Details
Closed on
Mar 13, 2015
Sold by
Perdigon Heberto F
Bought by
Perdigon Heberto F and Perdigon Ileana D
Current Estimated Value
Home Financials for this Owner
Home Financials are based on the most recent Mortgage that was taken out on this home.
Original Mortgage
$138,700
Outstanding Balance
$106,351
Interest Rate
3.79%
Mortgage Type
New Conventional
Estimated Equity
$333,297
Purchase Details
Closed on
Feb 26, 2015
Sold by
Diaz Eduardo Evelio
Bought by
Perdigon Heberto F
Home Financials for this Owner
Home Financials are based on the most recent Mortgage that was taken out on this home.
Original Mortgage
$138,700
Outstanding Balance
$106,351
Interest Rate
3.79%
Mortgage Type
New Conventional
Estimated Equity
$333,297
Purchase Details
Closed on
May 23, 2001
Sold by
Black Charles E and Black Rosa J
Bought by
Perdigon Henerto F
Home Financials for this Owner
Home Financials are based on the most recent Mortgage that was taken out on this home.
Original Mortgage
$140,000
Interest Rate
7.11%
Mortgage Type
New Conventional
Create a Home Valuation Report for This Property
The Home Valuation Report is an in-depth analysis detailing your home's value as well as a comparison with similar homes in the area
Home Values in the Area
Average Home Value in this Area
Purchase History
| Date | Buyer | Sale Price | Title Company |
|---|---|---|---|
| Perdigon Heberto F | -- | -- | |
| Perdigon Heberto F | -- | -- | |
| Perdigon Henerto F | $175,000 | -- |
Source: Public Records
Mortgage History
| Date | Status | Borrower | Loan Amount |
|---|---|---|---|
| Open | Perdigon Heberto F | $138,700 | |
| Previous Owner | Perdigon Henerto F | $140,000 |
Source: Public Records
Tax History Compared to Growth
Tax History
| Year | Tax Paid | Tax Assessment Tax Assessment Total Assessment is a certain percentage of the fair market value that is determined by local assessors to be the total taxable value of land and additions on the property. | Land | Improvement |
|---|---|---|---|---|
| 2025 | $4,348 | $160,096 | $48,000 | $112,096 |
| 2024 | $4,348 | $160,096 | $48,000 | $112,096 |
| 2023 | $4,348 | $160,096 | $48,000 | $112,096 |
| 2022 | $4,116 | $150,456 | $22,000 | $128,456 |
| 2021 | $3,308 | $120,320 | $22,000 | $98,320 |
| 2020 | $3,140 | $114,220 | $22,000 | $92,220 |
| 2019 | $3,140 | $114,220 | $22,000 | $92,220 |
| 2018 | $2,851 | $103,720 | $18,000 | $85,720 |
| 2017 | $1,997 | $77,444 | $18,000 | $59,444 |
| 2016 | $1,997 | $77,444 | $18,000 | $59,444 |
| 2015 | $433 | $67,640 | $18,000 | $49,640 |
| 2014 | $444 | $67,640 | $0 | $0 |
Source: Public Records
Map
Nearby Homes
- 203 Angla Dr SE
- 3808 Concord Approach Way SE
- 362 Doeskin Ln SE
- 524 Tackett Farms Rd
- 1375 Mosswood Ln SE
- 4135 Fawn Ln SE
- 317 Highview Dr SE
- 4195 Antler Trail SE
- 418 Mockingbird Ln SE
- 4025 Benell Ct SE
- 4246 Antler Trail SE
- 14 Geraldine Dr SE
- 63 Geraldine Dr SE
- 22 Geraldine Dr SE
- 18 Geraldine Dr SE
- 22 Vanessa Dr SE Unit 8
- 465 Willowbrook Dr SE
- 3664 Nessa Ct SE
- 88 Lucia Dr SE Unit 5
- 3981 Deerwood Pkwy SE
- 170 Concord Rd SE
- 213 Doeskin Ln SE Unit 1
- 203 Doeskin Ln SE
- 223 Doeskin Ln SE Unit 1
- 151 Concord Rd SE
- 145 Concord Rd SE
- 227 Doeskin Ln SE Unit 1
- 4000 Deerwood Pkwy SE Unit 1
- 4008 Deerwood Pkwy SE Unit 1
- 172 Concord Rd SE
- 100 Jeffrey Place
- 212 Doeskin Ln SE
- 222 Doeskin Ln SE
- 171 Concord Rd SE
- 102 Jeffrey Place
- 202 Doeskin Ln SE Unit 1
- 4020 Deerwood Pkwy SE
- 130 Concord Rd SE
- 104 Jeffrey Place