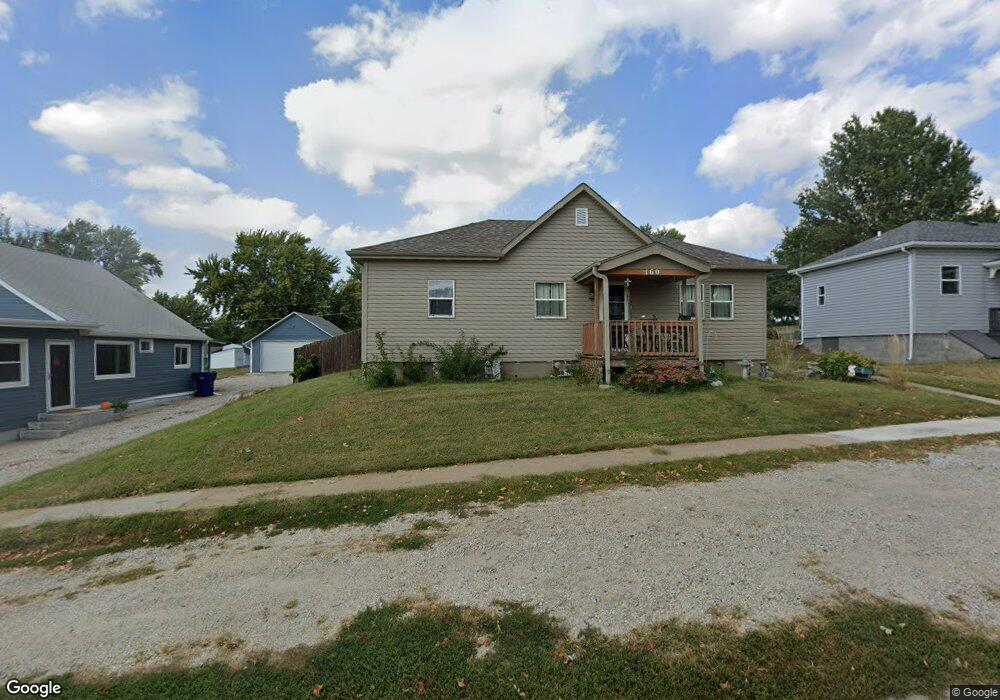
160 Elm St Springfield, NE 68059
Estimated Value: $181,000 - $345,000
2
Beds
3
Baths
1,574
Sq Ft
$155/Sq Ft
Est. Value
About This Home
This home is located at 160 Elm St, Springfield, NE 68059 and is currently estimated at $244,185, approximately $155 per square foot. 160 Elm St is a home located in Sarpy County with nearby schools including Platteview Central Junior High School and Platteview Senior High School.
Ownership History
Date
Name
Owned For
Owner Type
Purchase Details
Closed on
Nov 14, 2017
Sold by
Hill Patricia A and Hill Randy L
Bought by
Hill Randy L and Hill Patricia A
Current Estimated Value
Home Financials for this Owner
Home Financials are based on the most recent Mortgage that was taken out on this home.
Original Mortgage
$60,000
Outstanding Balance
$41,898
Interest Rate
3.94%
Mortgage Type
New Conventional
Estimated Equity
$202,287
Purchase Details
Closed on
Oct 12, 2016
Sold by
Peterson Arthur and Peterson Margaret
Bought by
Hill Patricia
Purchase Details
Closed on
Aug 26, 2005
Sold by
U S Bank Consumer Finance
Bought by
Peterson Arthur and Peterson Margaret
Purchase Details
Closed on
May 16, 2005
Sold by
Mccain Thomas R and Mccain Connie L
Bought by
Us Bank Consumer Finance
Purchase Details
Closed on
Nov 1, 2004
Sold by
Mccain Thomas R
Bought by
Mccain Connie L
Create a Home Valuation Report for This Property
The Home Valuation Report is an in-depth analysis detailing your home's value as well as a comparison with similar homes in the area
Purchase History
| Date | Buyer | Sale Price | Title Company |
|---|---|---|---|
| Hill Randy L | -- | None Available | |
| Hill Patricia | -- | None Available | |
| Peterson Arthur | $79,000 | Nebraska Title Company | |
| Us Bank Consumer Finance | -- | -- | |
| Mccain Connie L | -- | -- |
Source: Public Records
Mortgage History
| Date | Status | Borrower | Loan Amount |
|---|---|---|---|
| Open | Hill Randy L | $60,000 |
Source: Public Records
Tax History
| Year | Tax Paid | Tax Assessment Tax Assessment Total Assessment is a certain percentage of the fair market value that is determined by local assessors to be the total taxable value of land and additions on the property. | Land | Improvement |
|---|---|---|---|---|
| 2025 | $2,168 | $179,257 | $29,403 | $149,854 |
| 2024 | $2,585 | $175,035 | $29,403 | $145,632 |
| 2023 | $2,585 | $160,350 | $23,522 | $136,828 |
| 2022 | $2,432 | $133,223 | $23,522 | $109,701 |
| 2021 | $2,298 | $114,963 | $20,038 | $94,925 |
| 2020 | $2,442 | $114,025 | $20,038 | $93,987 |
| 2019 | $353 | $100,692 | $20,038 | $80,654 |
| 2018 | $1,008 | $95,825 | $20,038 | $75,787 |
| 2017 | $823 | $95,339 | $20,038 | $75,301 |
| 2016 | $2,102 | $90,710 | $20,038 | $70,672 |
| 2015 | $2,104 | $89,603 | $16,117 | $73,486 |
| 2014 | $2,015 | $85,103 | $16,117 | $68,986 |
| 2012 | -- | $86,815 | $16,117 | $70,698 |
Source: Public Records
Map
Nearby Homes
- 360 Main St
- 845 N 2nd St
- SE 1/4 18-13-12 Platteview Rd
- 545 N 10th Ave
- 509 S 7th St
- 225 N 10th Ave
- 13268 Bluebird Ct
- 19970 S 172 Plaza Cir
- Lots 103 to 106 Villa Springs
- 111 acres Platteview Rd
- 2028 Platteview Dr
- 2040 Platteview Dr
- 2056 Platteview Dr
- 200 Pr 6631
- 15709 S 180th St
- 11663 S 123rd St
- Lot 108
- 11575 Hardwood Dr
- 12170 S 115th St
- 17941 S 180th St
Your Personal Tour Guide
Ask me questions while you tour the home.