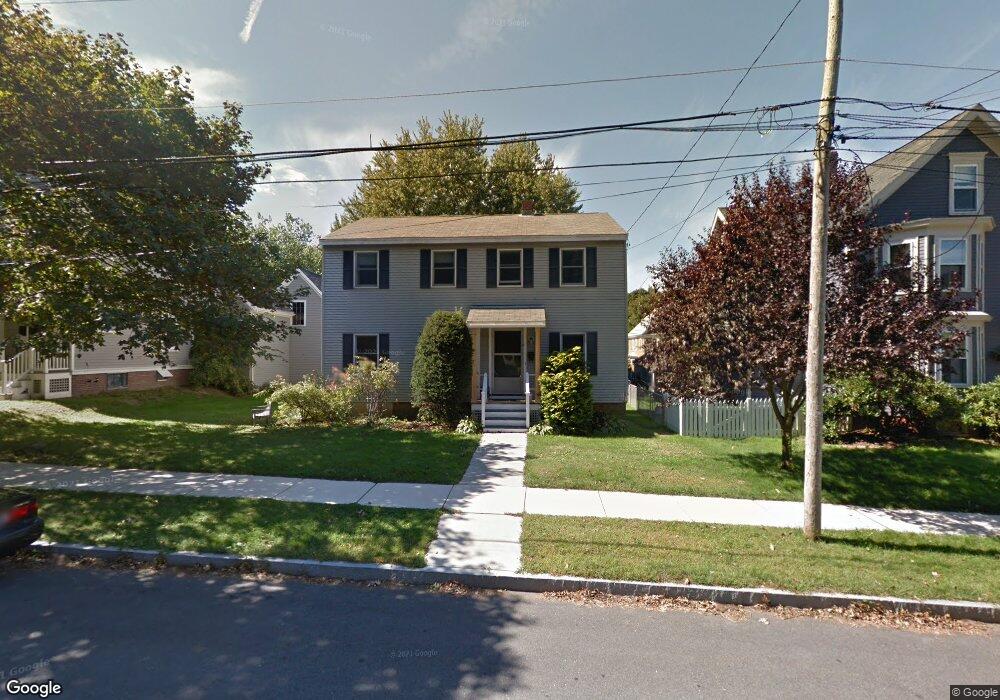
160 Elwyn Ave Portsmouth, NH 03801
Estimated Value: $1,268,191 - $1,568,000
3
Beds
2
Baths
2,040
Sq Ft
$688/Sq Ft
Est. Value
About This Home
This home is located at 160 Elwyn Ave, Portsmouth, NH 03801 and is currently estimated at $1,403,048, approximately $687 per square foot. 160 Elwyn Ave is a home located in Rockingham County with nearby schools including Little Harbour School, Portsmouth Middle School, and Portsmouth High School.
Ownership History
Date
Name
Owned For
Owner Type
Purchase Details
Closed on
Jun 8, 2011
Sold by
Barrett Michael R
Bought by
James A Mulvey Ret
Current Estimated Value
Purchase Details
Closed on
Mar 4, 1997
Sold by
Phyllis R Somerville R
Bought by
Barrett Michael R
Home Financials for this Owner
Home Financials are based on the most recent Mortgage that was taken out on this home.
Original Mortgage
$80,750
Interest Rate
7.78%
Mortgage Type
Purchase Money Mortgage
Create a Home Valuation Report for This Property
The Home Valuation Report is an in-depth analysis detailing your home's value as well as a comparison with similar homes in the area
Home Values in the Area
Average Home Value in this Area
Purchase History
| Date | Buyer | Sale Price | Title Company |
|---|---|---|---|
| James A Mulvey Ret | $91,400 | -- | |
| Barrett Michael R | $95,000 | -- |
Source: Public Records
Mortgage History
| Date | Status | Borrower | Loan Amount |
|---|---|---|---|
| Previous Owner | Barrett Michael R | $80,750 |
Source: Public Records
Tax History Compared to Growth
Tax History
| Year | Tax Paid | Tax Assessment Tax Assessment Total Assessment is a certain percentage of the fair market value that is determined by local assessors to be the total taxable value of land and additions on the property. | Land | Improvement |
|---|---|---|---|---|
| 2024 | $13,377 | $1,196,500 | $818,100 | $378,400 |
| 2023 | $10,264 | $636,300 | $416,300 | $220,000 |
| 2022 | $9,581 | $630,300 | $416,300 | $214,000 |
| 2021 | $9,473 | $630,300 | $416,300 | $214,000 |
| 2020 | $9,265 | $630,300 | $416,300 | $214,000 |
| 2019 | $9,366 | $630,300 | $416,300 | $214,000 |
| 2018 | $8,962 | $565,800 | $378,400 | $187,400 |
| 2017 | $8,702 | $565,800 | $378,400 | $187,400 |
| 2016 | $7,954 | $466,800 | $307,700 | $159,100 |
| 2015 | $7,838 | $466,800 | $307,700 | $159,100 |
| 2014 | $6,619 | $365,700 | $207,900 | $157,800 |
| 2013 | $6,550 | $365,700 | $207,900 | $157,800 |
| 2012 | $6,418 | $365,700 | $207,900 | $157,800 |
Source: Public Records
Map
Nearby Homes
- 210 South St
- 34 Highland St
- 161 Wibird St
- 21 Madison St
- 219 Sagamore Ave
- 238 Austin St
- 115 Court St
- 5 Old Parish Way
- 405 Pleasant St
- 325 Marcy St
- 198 Islington St Unit 6
- 4 Rock St Unit B
- 90 Fleet St Unit 4-5
- 33 Gardner St
- 51 Islington St Unit 406
- 149 Jones Ave
- 18 Congress St Unit 308
- 112 Mechanic St
- 332 Hanover St
- 70 Maplewood Ave Unit 305
- 150 Elwyn Ave
- 172 Elwyn Ave
- 140 Elwyn Ave
- 139 Sherburne Ave
- 194 Elwyn Ave
- 160 Sherburne Ave
- 161 Elwyn Ave
- 170 Sherburne Ave
- 150 Sherburne Ave
- 171 Elwyn Ave
- 151 Elwyn Ave
- 180 Sherburne Ave
- 126 Elwyn Ave
- 140 Sherburne Ave
- 206 Elwyn Ave
- 181 Elwyn Ave
- 137 Elwyn Ave
- 196 Sherburne Ave
- 118 Elwyn Ave
- 128 Sherburne Ave