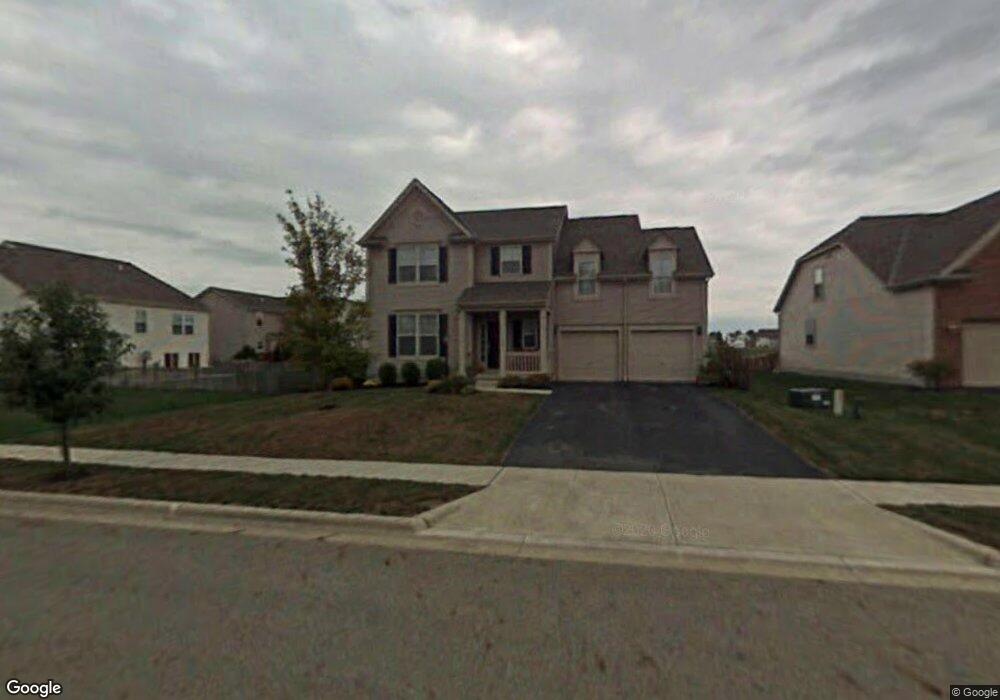
160 Fox Glen Dr W Pickerington, OH 43147
Estimated Value: $424,000 - $492,000
3
Beds
3
Baths
2,508
Sq Ft
$179/Sq Ft
Est. Value
About This Home
This home is located at 160 Fox Glen Dr W, Pickerington, OH 43147 and is currently estimated at $448,205, approximately $178 per square foot. 160 Fox Glen Dr W is a home located in Fairfield County with nearby schools including Sycamore Creek Elementary School, Diley Middle School, and Pickerington Ridgeview Junior High School.
Ownership History
Date
Name
Owned For
Owner Type
Purchase Details
Closed on
Oct 4, 2021
Sold by
Tokar Travis P and Tokar Catherine E
Bought by
Landis Properties Ii Llc
Current Estimated Value
Purchase Details
Closed on
Aug 31, 2006
Sold by
M I Homes Of Central Ohio Llc
Bought by
Tokar Travis P and Tokar Catherine E
Home Financials for this Owner
Home Financials are based on the most recent Mortgage that was taken out on this home.
Original Mortgage
$274,000
Interest Rate
6.77%
Mortgage Type
Purchase Money Mortgage
Create a Home Valuation Report for This Property
The Home Valuation Report is an in-depth analysis detailing your home's value as well as a comparison with similar homes in the area
Home Values in the Area
Average Home Value in this Area
Purchase History
| Date | Buyer | Sale Price | Title Company |
|---|---|---|---|
| Landis Properties Ii Llc | $350,000 | Bchh Inc | |
| Tokar Travis P | $274,500 | Transohio Residential Title |
Source: Public Records
Mortgage History
| Date | Status | Borrower | Loan Amount |
|---|---|---|---|
| Previous Owner | Tokar Travis P | $274,000 |
Source: Public Records
Tax History Compared to Growth
Tax History
| Year | Tax Paid | Tax Assessment Tax Assessment Total Assessment is a certain percentage of the fair market value that is determined by local assessors to be the total taxable value of land and additions on the property. | Land | Improvement |
|---|---|---|---|---|
| 2024 | $14,786 | $120,110 | $14,510 | $105,600 |
| 2023 | $5,801 | $120,110 | $14,510 | $105,600 |
| 2022 | $5,820 | $120,110 | $14,510 | $105,600 |
| 2021 | $5,064 | $91,180 | $14,510 | $76,670 |
| 2020 | $5,120 | $91,180 | $14,510 | $76,670 |
| 2019 | $5,152 | $91,180 | $14,510 | $76,670 |
| 2018 | $5,012 | $78,850 | $14,510 | $64,340 |
| 2017 | $5,020 | $77,330 | $12,990 | $64,340 |
| 2016 | $4,994 | $77,330 | $12,990 | $64,340 |
| 2015 | $4,769 | $69,820 | $10,820 | $59,000 |
| 2014 | $4,711 | $69,820 | $10,820 | $59,000 |
| 2013 | $4,711 | $69,820 | $10,820 | $59,000 |
Source: Public Records
Map
Nearby Homes
- 147 Longleaf St
- 116 Kohler St
- 318 Linden Cir
- 317 Audubon St
- 103 Carr Ct
- 184 Pickerington Ponds Dr
- 180 Pickerington Ponds Dr
- Winston Plan at The Reserve at Pickerington Ponds - Designer Collection
- Grandin Plan at Sycamore Springs - Designer Collection
- Carrington Plan at Sycamore Springs - Designer Collection
- Wyatt Plan at Sycamore Springs - Designer Collection
- Denali Plan at Sycamore Springs - Maple Street Collection
- Magnolia Plan at Sycamore Springs - Designer Collection
- Avery Plan at Sycamore Springs - Designer Collection
- Preston Plan at Sycamore Springs - Maple Street Collection
- Fairfax Plan at Sycamore Springs - Maple Street Collection
- Greenbriar Plan at Sycamore Springs - Maple Street Collection
- DaVinci Plan at Sycamore Springs - Maple Street Collection
- Emmett Plan at Sycamore Springs - Designer Collection
- Yosemite Plan at Sycamore Springs - Maple Street Collection
- 150 Fox Glen Dr W
- 154 Fox Glen Dr W
- 156 Fox Glen Dr W
- 146 Fox Glen Dr W
- 161 Fox Glen Dr W
- 157 Fox Glen Dr W
- 158 Fox Glen Dr W
- 155 Fox Glen Dr W
- 142 Fox Glen Dr W
- 151 Fox Glen Dr W
- 169 Fox Glen Dr W
- 159 Fox Glen Dr W
- 159 Fox Glen Dr W Unit 20
- 147 Fox Glen Dr W
- 202 Carson Ct
- 163 Fox Glen Dr W
- 206 Carson Ct
- 138 Fox Glen Dr W
- 143 Fox Glen Dr W
- 177 Fox Glen Dr W