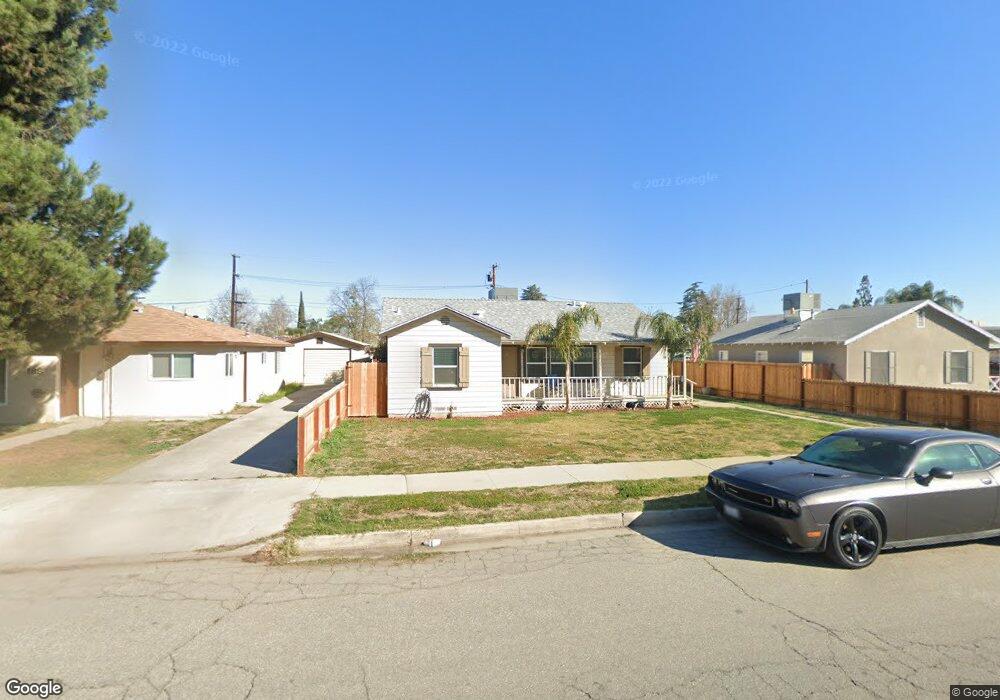
160 Golden West Ave Shafter, CA 93263
Estimated Value: $223,000 - $316,000
3
Beds
2
Baths
1,182
Sq Ft
$233/Sq Ft
Est. Value
About This Home
This home is located at 160 Golden West Ave, Shafter, CA 93263 and is currently estimated at $275,933, approximately $233 per square foot. 160 Golden West Ave is a home located in Kern County with nearby schools including Golden Oak Elementary School, Redwood Elementary School, and Shafter High School.
Ownership History
Date
Name
Owned For
Owner Type
Purchase Details
Closed on
Aug 16, 2016
Sold by
G3 Investment Group Inc
Bought by
Leon Sylvia
Current Estimated Value
Home Financials for this Owner
Home Financials are based on the most recent Mortgage that was taken out on this home.
Original Mortgage
$157,102
Interest Rate
3.87%
Mortgage Type
FHA
Purchase Details
Closed on
May 9, 2016
Sold by
Smith Richard Dwayne and Smith Corliss Robert
Bought by
G3 Investment Group Inc and Local Home Solutions
Home Financials for this Owner
Home Financials are based on the most recent Mortgage that was taken out on this home.
Original Mortgage
$113,900
Interest Rate
3.71%
Mortgage Type
Purchase Money Mortgage
Purchase Details
Closed on
Oct 21, 2009
Sold by
Smith Corliss Robert and Smith Dixie J
Bought by
Smith Corliss R and Smith Dixie J
Create a Home Valuation Report for This Property
The Home Valuation Report is an in-depth analysis detailing your home's value as well as a comparison with similar homes in the area
Home Values in the Area
Average Home Value in this Area
Purchase History
| Date | Buyer | Sale Price | Title Company |
|---|---|---|---|
| Leon Sylvia | $160,000 | Placer Title Company | |
| G3 Investment Group Inc | $82,000 | Placer Title Company | |
| Smith Corliss R | -- | None Available |
Source: Public Records
Mortgage History
| Date | Status | Borrower | Loan Amount |
|---|---|---|---|
| Previous Owner | Leon Sylvia | $157,102 | |
| Previous Owner | G3 Investment Group Inc | $113,900 |
Source: Public Records
Tax History Compared to Growth
Tax History
| Year | Tax Paid | Tax Assessment Tax Assessment Total Assessment is a certain percentage of the fair market value that is determined by local assessors to be the total taxable value of land and additions on the property. | Land | Improvement |
|---|---|---|---|---|
| 2025 | $2,322 | $185,689 | $34,815 | $150,874 |
| 2024 | $2,247 | $182,049 | $34,133 | $147,916 |
| 2023 | $2,247 | $178,480 | $33,464 | $145,016 |
| 2022 | $2,171 | $174,981 | $32,808 | $142,173 |
| 2021 | $2,103 | $171,551 | $32,165 | $139,386 |
| 2020 | $2,045 | $169,793 | $31,836 | $137,957 |
| 2019 | $2,040 | $169,793 | $31,836 | $137,957 |
| 2018 | $1,962 | $163,200 | $30,600 | $132,600 |
| 2017 | $1,966 | $160,000 | $30,000 | $130,000 |
| 2016 | $366 | $26,336 | $6,467 | $19,869 |
| 2015 | $343 | $25,941 | $6,370 | $19,571 |
| 2014 | $328 | $25,434 | $6,246 | $19,188 |
Source: Public Records
Map
Nearby Homes
- 188 N Wall St
- 208 California Ave
- 209 Pacific Ave
- 436 N Reiker St
- 408 W Euclid Ave
- 249 E Marengo Ave
- 403 W Euclid Ave
- 137 W Ash Ave
- 0 Beech Ave Unit IG25056068
- 0 Lerdo Hwy Unit 202506871
- 0 Beech Ave Unit 202305944
- 187 E Orange Ave
- 419 Santa Maria Way
- 164 Rodriguez Ave
- 9418 Laurelwood Ct
- 9211 Woodbrook Dr
- 681 California 43
- 700 S Shafter Ave Unit 115
- 553 Grundy Ave
- 300 Mannel Ave
- 188 Golden West Ave
- 150 Golden Ave W
- 188 Golden Ave W
- 150 Golden West Ave
- 198 Golden West Ave
- 219 N Grant St
- 198 Golden Ave W
- 238 N Wall St
- 140 Golden West Ave
- 225 N Grant St
- 244 N Wall St
- 237 N Grant St
- 165 Golden Ave W
- 187 Golden Ave W
- 179 Golden West Ave
- 165 Golden West Ave
- 187 Golden West Ave
- 149 Golden Ave W
- 155 Golden West Ave
- 134 Golden West Ave