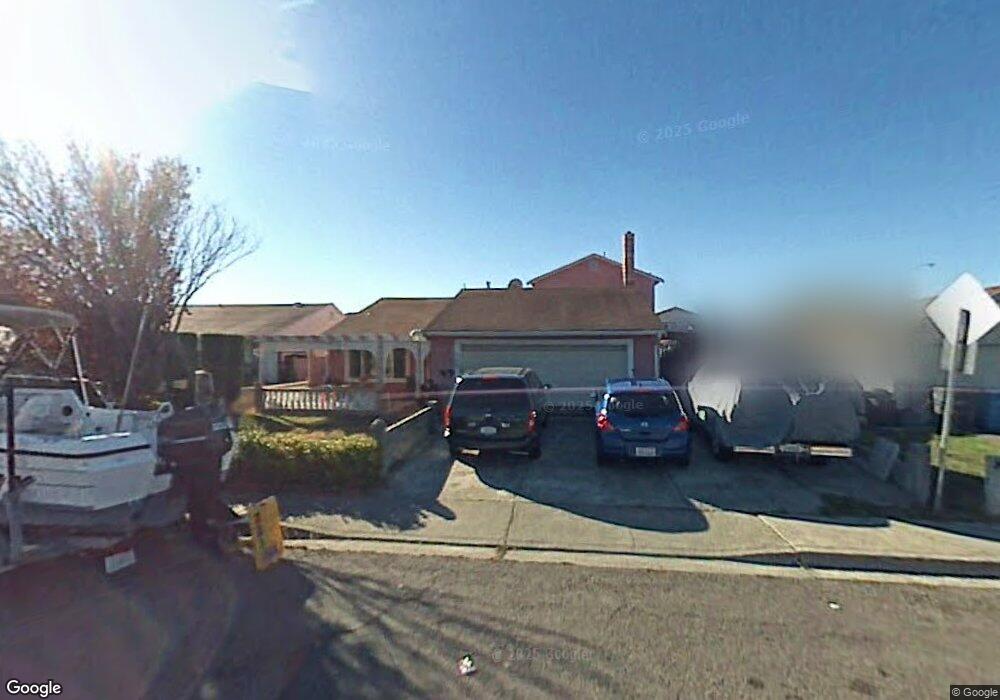
160 Larsen Cir Vallejo, CA 94589
North Vallejo NeighborhoodEstimated Value: $522,000 - $627,000
4
Beds
3
Baths
2,082
Sq Ft
$270/Sq Ft
Est. Value
About This Home
This home is located at 160 Larsen Cir, Vallejo, CA 94589 and is currently estimated at $561,669, approximately $269 per square foot. 160 Larsen Cir is a home located in Solano County with nearby schools including Dan Mini Elementary School, Solano Middle School, and Vallejo High School.
Ownership History
Date
Name
Owned For
Owner Type
Purchase Details
Closed on
Jun 14, 2015
Sold by
Sebastian Lito Trillana and Sebastian Bella Rillera
Bought by
Sebastian Lito Trillana and Sebastian Bella Rillera
Current Estimated Value
Purchase Details
Closed on
Jan 18, 2003
Sold by
Sebastian Lito T
Bought by
Sebastian Lito T and Sebastian Bella R
Home Financials for this Owner
Home Financials are based on the most recent Mortgage that was taken out on this home.
Original Mortgage
$84,500
Interest Rate
5.11%
Mortgage Type
Purchase Money Mortgage
Purchase Details
Closed on
Jan 8, 1997
Sold by
Federal National Mortgage Association
Bought by
Sebastian Lito T
Home Financials for this Owner
Home Financials are based on the most recent Mortgage that was taken out on this home.
Original Mortgage
$92,150
Interest Rate
7.58%
Mortgage Type
Seller Take Back
Purchase Details
Closed on
Aug 30, 1996
Sold by
Silva Carlos C and Silva Patricia P
Bought by
Federal National Mortgage Association
Create a Home Valuation Report for This Property
The Home Valuation Report is an in-depth analysis detailing your home's value as well as a comparison with similar homes in the area
Home Values in the Area
Average Home Value in this Area
Purchase History
| Date | Buyer | Sale Price | Title Company |
|---|---|---|---|
| Sebastian Lito Trillana | -- | None Available | |
| Sebastian Lito T | -- | First American Title Co | |
| Sebastian Lito T | $95,000 | Fidelity National Title Co | |
| Federal National Mortgage Association | $135,000 | First American Title Ins Co |
Source: Public Records
Mortgage History
| Date | Status | Borrower | Loan Amount |
|---|---|---|---|
| Closed | Sebastian Lito T | $84,500 | |
| Closed | Sebastian Lito T | $92,150 |
Source: Public Records
Tax History Compared to Growth
Tax History
| Year | Tax Paid | Tax Assessment Tax Assessment Total Assessment is a certain percentage of the fair market value that is determined by local assessors to be the total taxable value of land and additions on the property. | Land | Improvement |
|---|---|---|---|---|
| 2025 | $3,641 | $226,383 | $57,004 | $169,379 |
| 2024 | $3,641 | $221,945 | $55,887 | $166,058 |
| 2023 | $3,412 | $217,594 | $54,792 | $162,802 |
| 2022 | $3,312 | $213,328 | $53,718 | $159,610 |
| 2021 | $3,239 | $209,146 | $52,665 | $156,481 |
| 2020 | $3,244 | $207,002 | $52,125 | $154,877 |
| 2019 | $3,137 | $202,944 | $51,103 | $151,841 |
| 2018 | $2,931 | $198,965 | $50,101 | $148,864 |
| 2017 | $2,792 | $195,065 | $49,119 | $145,946 |
| 2016 | $2,223 | $191,241 | $48,156 | $143,085 |
| 2015 | $2,194 | $188,369 | $47,433 | $140,936 |
| 2014 | $2,163 | $184,680 | $46,504 | $138,176 |
Source: Public Records
Map
Nearby Homes
- 316 Meadows Dr
- 1863 Mini Dr
- 160 Shari Ct
- 121 Forsythia Ct
- 115 Kilty Ct
- 140 Boggs Ct
- 150 Daisy Ct
- 111 Spencer St
- 149 Drytown Ct
- 1634 Severus Dr
- 337 Falcon Dr
- 240 Rinaldo Dr
- 2041 Severus Dr
- 121 Yankee Jim Ct
- 205 Marla Dr
- 203 Baylor Dr Unit 11
- 289 Catalina Way
- 129 Violet Dr
- 139 Marquette Ave
- 420 Corcoran Ave Unit 4