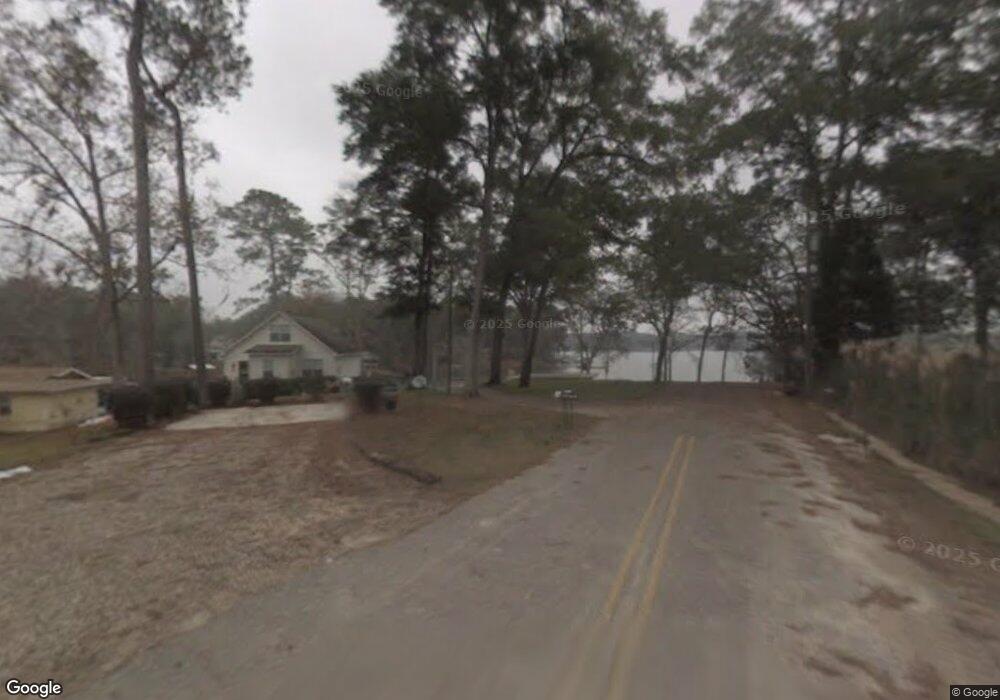
160 Loop Dr Quincy, FL 32351
Estimated Value: $393,098 - $488,000
3
Beds
2
Baths
2,176
Sq Ft
$205/Sq Ft
Est. Value
About This Home
This home is located at 160 Loop Dr, Quincy, FL 32351 and is currently estimated at $447,025, approximately $205 per square foot. 160 Loop Dr is a home located in Gadsden County.
Ownership History
Date
Name
Owned For
Owner Type
Purchase Details
Closed on
Jun 25, 2010
Sold by
Whetstone Sandra S and Hannon Sherry Whetstone
Bought by
Daniel Robert E and Daniel Jennifer J
Current Estimated Value
Home Financials for this Owner
Home Financials are based on the most recent Mortgage that was taken out on this home.
Original Mortgage
$192,000
Interest Rate
4.91%
Mortgage Type
New Conventional
Purchase Details
Closed on
Dec 23, 2008
Sold by
Hannon Sherry Whetstone and Whetstone Sandra S
Bought by
Whetstone Sandra S and Hannon Sherry Whetstone
Purchase Details
Closed on
Apr 14, 2004
Sold by
Maxwell John K and Maxwell Diane P
Bought by
Whetstone Woodrow W
Home Financials for this Owner
Home Financials are based on the most recent Mortgage that was taken out on this home.
Original Mortgage
$164,000
Interest Rate
5.38%
Mortgage Type
Purchase Money Mortgage
Create a Home Valuation Report for This Property
The Home Valuation Report is an in-depth analysis detailing your home's value as well as a comparison with similar homes in the area
Purchase History
| Date | Buyer | Sale Price | Title Company |
|---|---|---|---|
| Daniel Robert E | $240,000 | Destination Title Svcs Llc | |
| Whetstone Sandra S | -- | Attorney | |
| Whetstone Woodrow W | $205,000 | -- |
Source: Public Records
Mortgage History
| Date | Status | Borrower | Loan Amount |
|---|---|---|---|
| Closed | Daniel Robert E | $192,000 | |
| Previous Owner | Whetstone Woodrow W | $164,000 |
Source: Public Records
Tax History
| Year | Tax Paid | Tax Assessment Tax Assessment Total Assessment is a certain percentage of the fair market value that is determined by local assessors to be the total taxable value of land and additions on the property. | Land | Improvement |
|---|---|---|---|---|
| 2025 | $4,309 | $301,956 | $155,562 | $146,394 |
| 2024 | $4,297 | $301,379 | $155,089 | $146,290 |
| 2023 | $3,902 | $269,388 | $147,366 | $122,022 |
| 2022 | $3,686 | $266,285 | $145,790 | $120,495 |
| 2021 | $3,330 | $223,410 | $136,253 | $87,157 |
| 2020 | $3,324 | $223,681 | $136,252 | $87,429 |
| 2019 | $3,246 | $213,923 | $125,205 | $88,718 |
| 2018 | $3,183 | $206,558 | $0 | $0 |
| 2017 | $3,197 | $206,558 | $0 | $0 |
| 2016 | $3,268 | $207,848 | $0 | $0 |
| 2015 | $3,347 | $209,138 | $0 | $0 |
| 2014 | $3,339 | $207,676 | $0 | $0 |
Source: Public Records
Map
Nearby Homes
- 85 Cool Springs Ln
- 309 Davidson St
- 399 Davidson St
- 153 Davidson St
- 179 Davidson St
- 997 Drake Acres Rd
- 941 Drake Acres Rd
- 890 Drake Acres Rd
- 129 Ocklawaha Cir
- 26 Anns Aly
- 414 Tharpe Cir
- Lot 15 Tharpe Cir
- 2376 Lakeview Point Rd
- 408 Drake Acres Rd
- 66 Tharpe Cir
- 3842 Edgewater Dr
- 3830 Edgewater Dr
- 2758 Deborah Dr
- 3938 Edgewater Dr
- 0 Parramore Shores Lot 6 Rd Unit 392916
- 170 Loop Dr
- 156 Loop Dr
- 494 Talquin Ave
- 504 Talquin Ave
- 152 Loop Dr
- 120 Loop Dr
- 469 Talquin Ave
- 850 Talquin Ave
- 112 Loop Dr
- 0 Talquin Ave Unit 248122
- 0 Talquin Ave Unit 182258
- 0 Talquin Ave Unit 5 190961
- 0 Talquin Ave Unit 193649
- 0 Talquin Ave Unit 193505
- 0 Talquin Ave Unit 195589
- 0 Talquin Ave Unit 195588
- 0 Talquin Ave Unit 199590
- 0 Talquin Ave Unit 202805
- 0 Talquin Ave Unit ~ 207083
- 0 Talquin Ave Unit 240950
Your Personal Tour Guide
Ask me questions while you tour the home.