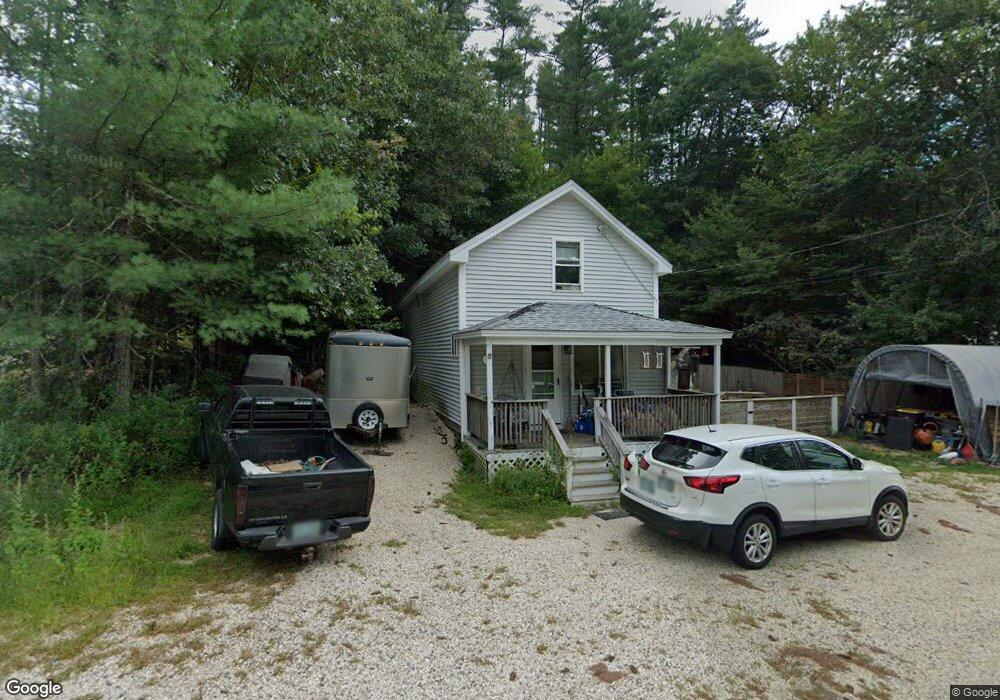
160 Main St Fremont, NH 03044
Estimated Value: $321,000 - $402,000
2
Beds
2
Baths
840
Sq Ft
$407/Sq Ft
Est. Value
About This Home
This home is located at 160 Main St, Fremont, NH 03044 and is currently estimated at $341,880, approximately $407 per square foot. 160 Main St is a home located in Rockingham County with nearby schools including Ellis School.
Ownership History
Date
Name
Owned For
Owner Type
Purchase Details
Closed on
Jun 3, 2025
Sold by
Philbrick William C
Bought by
Philbrick Tanya M
Current Estimated Value
Purchase Details
Closed on
Nov 27, 2007
Sold by
Fnma
Bought by
Philbrick William C
Home Financials for this Owner
Home Financials are based on the most recent Mortgage that was taken out on this home.
Original Mortgage
$142,200
Interest Rate
6.42%
Mortgage Type
Purchase Money Mortgage
Purchase Details
Closed on
May 10, 2007
Sold by
Riley Chester A
Bought by
Federal National Mortgage Association
Purchase Details
Closed on
Aug 18, 2000
Sold by
Giampa Michael F
Bought by
Riley Chester A
Purchase Details
Closed on
Aug 29, 1996
Sold by
Alexander Scott D
Bought by
Giampa Michael F
Create a Home Valuation Report for This Property
The Home Valuation Report is an in-depth analysis detailing your home's value as well as a comparison with similar homes in the area
Home Values in the Area
Average Home Value in this Area
Purchase History
| Date | Buyer | Sale Price | Title Company |
|---|---|---|---|
| Philbrick Tanya M | -- | -- | |
| Philbrick Tanya M | -- | -- | |
| Philbrick William C | $79,000 | -- | |
| Philbrick William C | $79,000 | -- | |
| Federal National Mortgage Association | $177,100 | -- | |
| Federal National Mortgage Association | $177,100 | -- | |
| Riley Chester A | $117,000 | -- | |
| Riley Chester A | $117,000 | -- | |
| Giampa Michael F | $84,000 | -- | |
| Giampa Michael F | $84,000 | -- |
Source: Public Records
Mortgage History
| Date | Status | Borrower | Loan Amount |
|---|---|---|---|
| Previous Owner | Giampa Michael F | $134,546 | |
| Previous Owner | Giampa Michael F | $142,200 |
Source: Public Records
Tax History Compared to Growth
Tax History
| Year | Tax Paid | Tax Assessment Tax Assessment Total Assessment is a certain percentage of the fair market value that is determined by local assessors to be the total taxable value of land and additions on the property. | Land | Improvement |
|---|---|---|---|---|
| 2024 | $4,151 | $157,400 | $72,300 | $85,100 |
| 2023 | $3,713 | $157,400 | $72,300 | $85,100 |
| 2022 | $3,650 | $157,400 | $72,300 | $85,100 |
| 2021 | $3,513 | $157,400 | $72,300 | $85,100 |
| 2020 | $3,641 | $157,400 | $72,300 | $85,100 |
| 2019 | $3,773 | $121,500 | $51,500 | $70,000 |
| 2018 | $3,505 | $121,500 | $51,500 | $70,000 |
| 2017 | $3,630 | $121,500 | $51,500 | $70,000 |
| 2016 | $3,630 | $121,500 | $51,500 | $70,000 |
| 2015 | $3,524 | $121,500 | $51,500 | $70,000 |
| 2014 | $3,361 | $119,100 | $51,500 | $67,600 |
| 2013 | $3,396 | $119,100 | $51,500 | $67,600 |
Source: Public Records
Map
Nearby Homes