Estimated Value: $1,715,000 - $2,008,000
3
Beds
3
Baths
2,616
Sq Ft
$706/Sq Ft
Est. Value
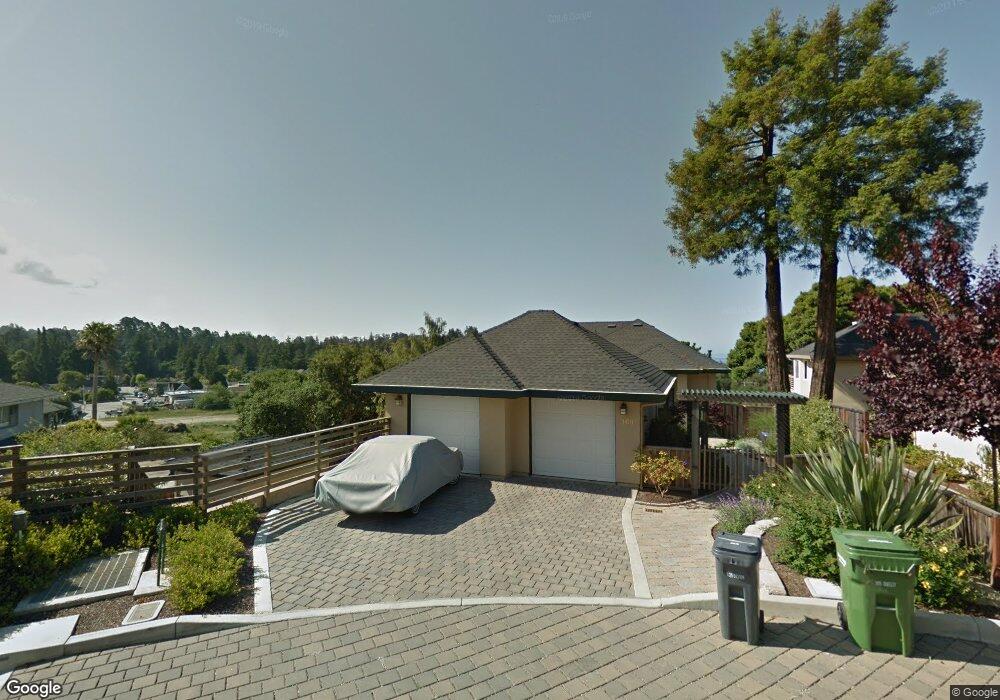
About This Home
This home is located at 160 Mattison Ct, Aptos, CA 95003 and is currently estimated at $1,848,129, approximately $706 per square foot. 160 Mattison Ct is a home located in Santa Cruz County with nearby schools including Valencia Elementary School, Aptos Junior High School, and Aptos High School.
Ownership History
Date
Name
Owned For
Owner Type
Purchase Details
Closed on
Oct 12, 2009
Sold by
Mattison Lane Llc
Bought by
Francisco Samuel M and Francisco Living Trust
Current Estimated Value
Home Financials for this Owner
Home Financials are based on the most recent Mortgage that was taken out on this home.
Original Mortgage
$729,750
Outstanding Balance
$475,054
Interest Rate
5.02%
Mortgage Type
New Conventional
Estimated Equity
$1,373,075
Purchase Details
Closed on
Feb 22, 2006
Sold by
Bailey Robert and Bailey Lillie
Bought by
The Holcomb Corp
Home Financials for this Owner
Home Financials are based on the most recent Mortgage that was taken out on this home.
Original Mortgage
$420,000
Interest Rate
6.08%
Mortgage Type
Unknown
Create a Home Valuation Report for This Property
The Home Valuation Report is an in-depth analysis detailing your home's value as well as a comparison with similar homes in the area
Home Values in the Area
Average Home Value in this Area
Purchase History
| Date | Buyer | Sale Price | Title Company |
|---|---|---|---|
| Francisco Samuel M | $990,000 | Old Republic Title Company | |
| The Holcomb Corp | $1,600,000 | Santa Cruz Title Company |
Source: Public Records
Mortgage History
| Date | Status | Borrower | Loan Amount |
|---|---|---|---|
| Open | Francisco Samuel M | $729,750 | |
| Previous Owner | The Holcomb Corp | $420,000 | |
| Previous Owner | The Holcomb Corp | $1,047,088 |
Source: Public Records
Tax History
| Year | Tax Paid | Tax Assessment Tax Assessment Total Assessment is a certain percentage of the fair market value that is determined by local assessors to be the total taxable value of land and additions on the property. | Land | Improvement |
|---|---|---|---|---|
| 2025 | $14,837 | $1,277,917 | $664,775 | $613,142 |
| 2023 | $14,552 | $1,228,294 | $638,961 | $589,333 |
| 2022 | $14,253 | $1,204,209 | $626,432 | $577,777 |
| 2021 | $13,879 | $1,180,597 | $614,149 | $566,448 |
| 2020 | $13,653 | $1,168,492 | $607,852 | $560,640 |
| 2019 | $13,411 | $1,145,580 | $595,933 | $549,647 |
| 2018 | $13,054 | $1,123,118 | $584,248 | $538,870 |
| 2017 | $12,940 | $1,101,096 | $572,792 | $528,304 |
| 2016 | $12,611 | $1,079,506 | $561,561 | $517,945 |
| 2015 | $12,519 | $1,063,291 | $553,126 | $510,165 |
| 2014 | $11,340 | $961,272 | $425,880 | $535,392 |
Source: Public Records
Map
Nearby Homes
- 111 Aptos Village Way Unit 4
- 111 Aptos Village Way Unit 1
- 131 Aptos Village Way Unit 4
- 131 Aptos Village Way Unit 2
- 101 Aptos Village Way Unit 4
- 101 Aptos Village Way Unit 1
- 126 Aptos Village Way Unit 2
- 450 Granite Way
- 532 Moonrise Ln
- 307 Moosehead Dr
- 000 Burns Ave
- 300 Carrera Cir
- 118 Sea Terrace Way
- 373 Sandalwood Dr
- 254 Center Ave
- 261 Aptos Beach Dr
- 347 Treasure Island Dr
- 146 Aptos School Rd
- 307 Treasure Island Dr Unit 1
- 530 Quail Run Rd
- 107 Village Dr
- 146 Mattison Ct
- 105 Village Dr
- 103 Village Dr
- 138 Mattison Ct
- 106 Village Dr Unit A
- 112 Village Dr
- 124 Mattison Ct
- 100 Village Dr Unit A
- 329 Granite Way
- 331 Granite Way
- 110 Mattison Ct
- 333 Granite Way
- 333 Granite Way Unit 333
- 141 Village Dr Unit 307
- 141 Village Dr Unit 208
- 141 Village Dr Unit 207
- 337 Granite Way
- 116 Vista Mar Ct
- 112 Vista Mar Ct
Your Personal Tour Guide
Ask me questions while you tour the home.